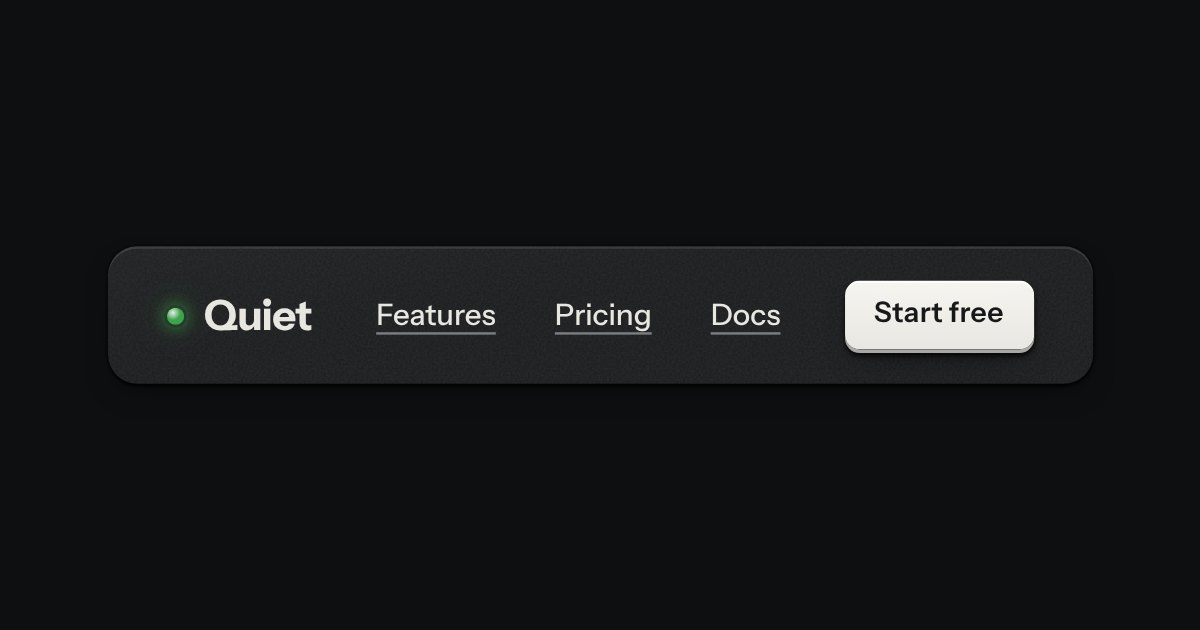
Bar
The top of a page: a wordmark with a lamp, printed links, and one contrast key at most.
Templates
A monthly report laid out like a printed annual report. Nothing moves at rest. Loading, no-events, error and recounting states included.
The top of a page: a wordmark with a lamp, printed links, and one contrast key at most.
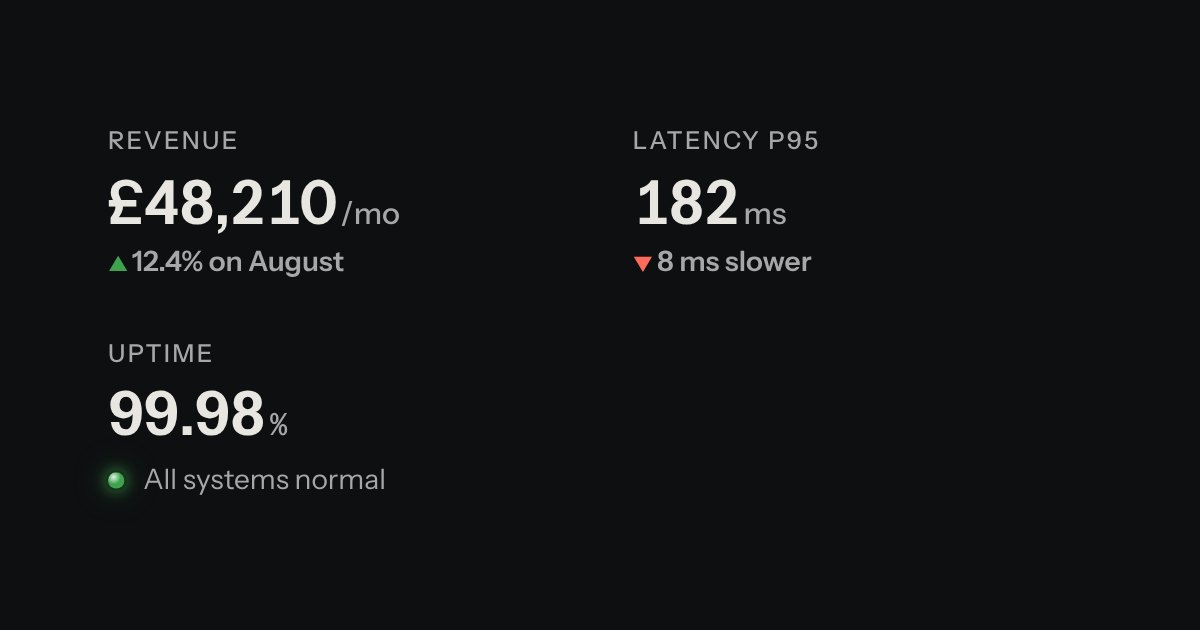
A printed label over a value: key figures, with the unit small and the change in words.
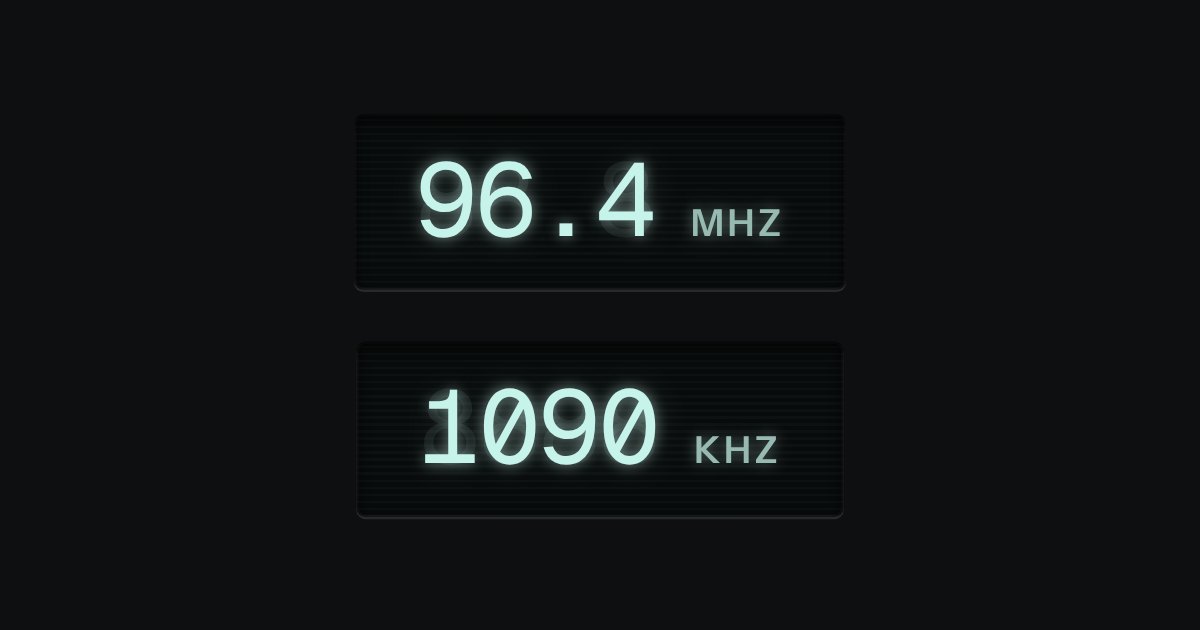
A vacuum-fluorescent display: cyan-white light on near-black glass, with a glow and a ghost. Frequencies, levels, status screens.
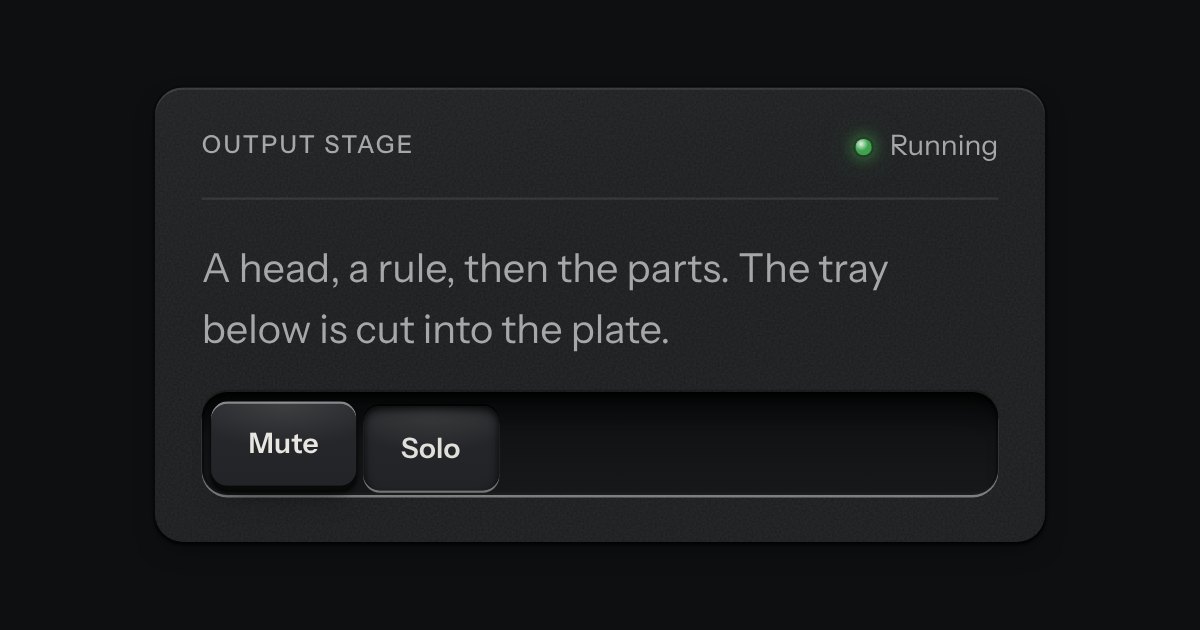
A face plate that groups what belongs together: a head, a rule, then the parts. Screws only on device-like panels.
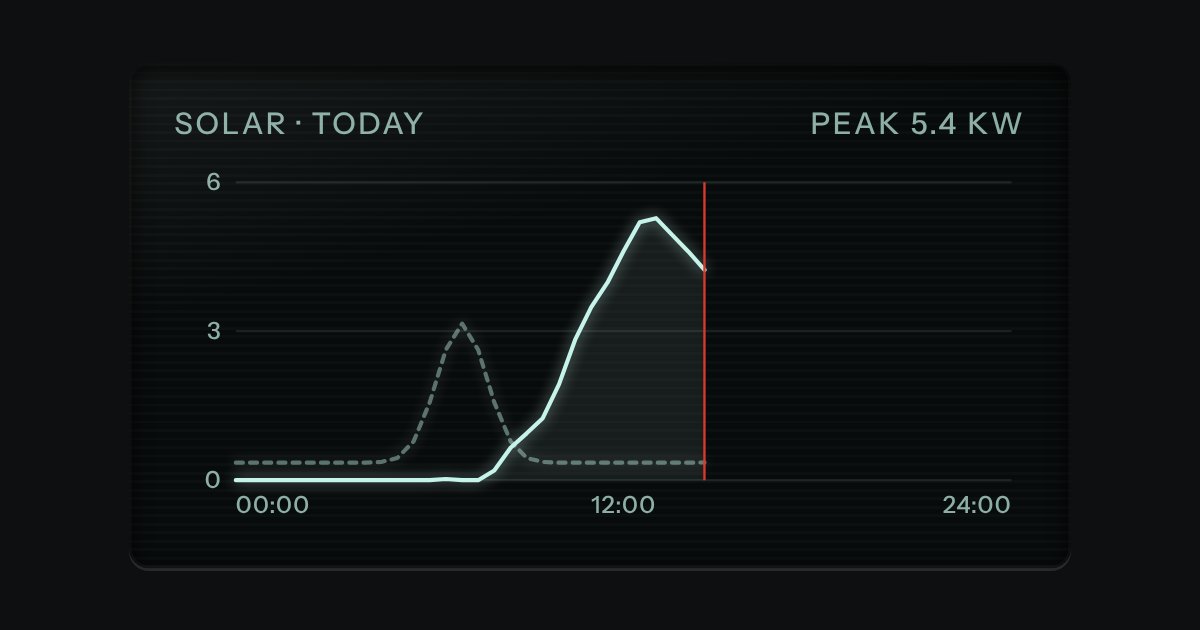
Dark display glass for plots and live readouts, whatever the finish around it. Everything printed inside it is lit.
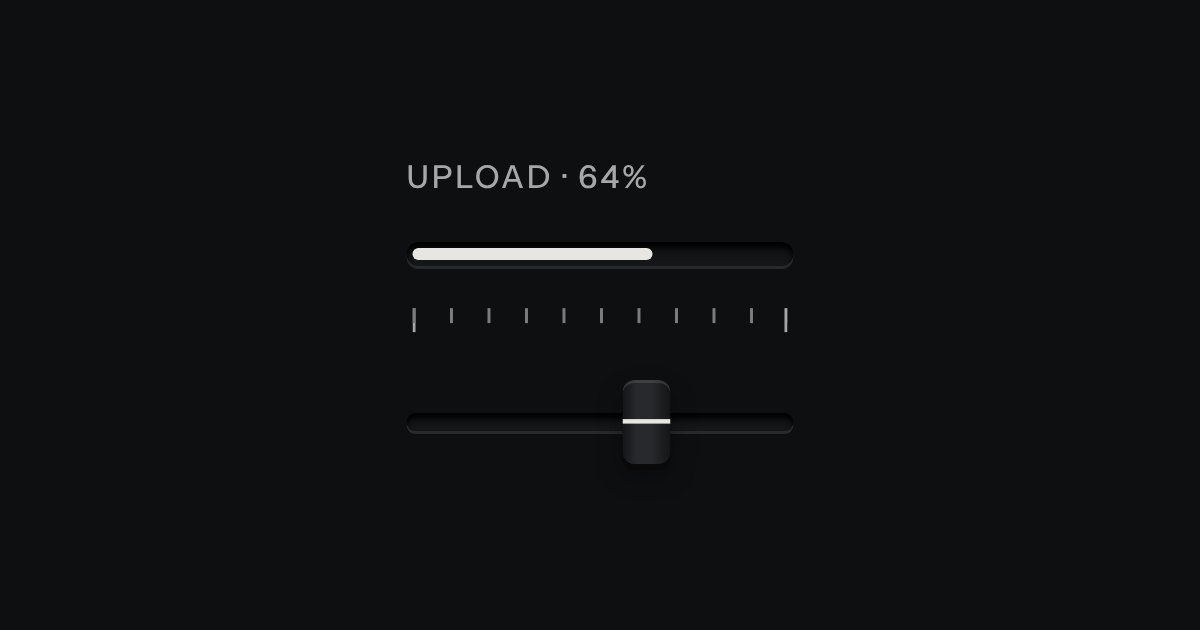
Progress through a task: ink filling a groove, never a coloured bar.
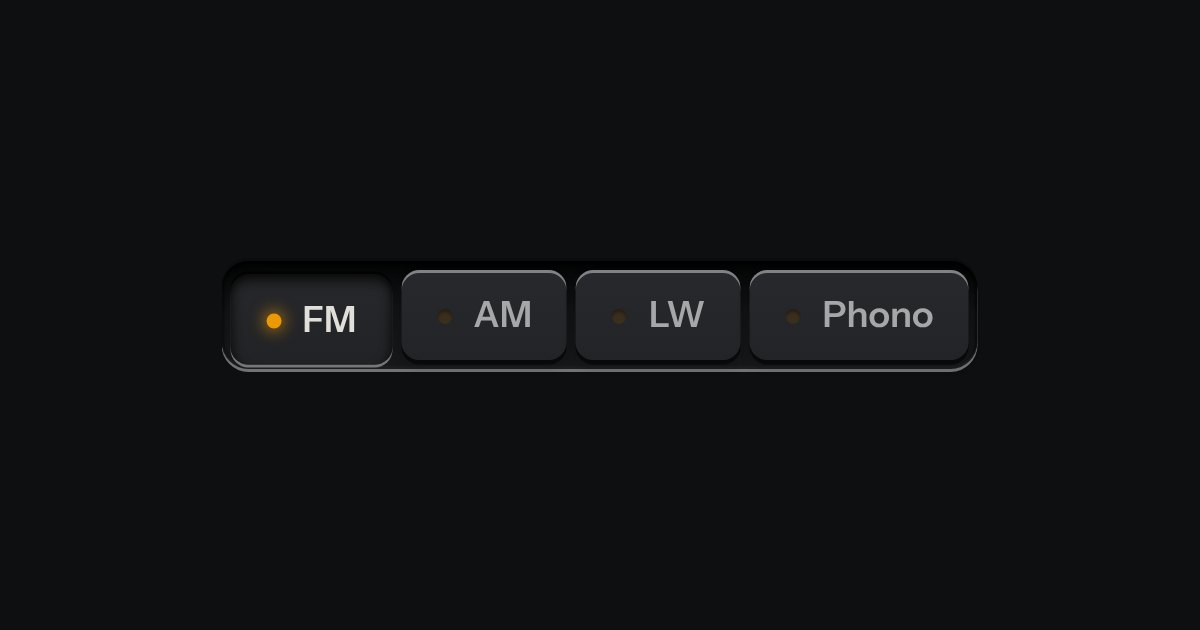
One mode of two to five: latching keys in a tray, one down at a time, each with a lamp that lights when chosen.
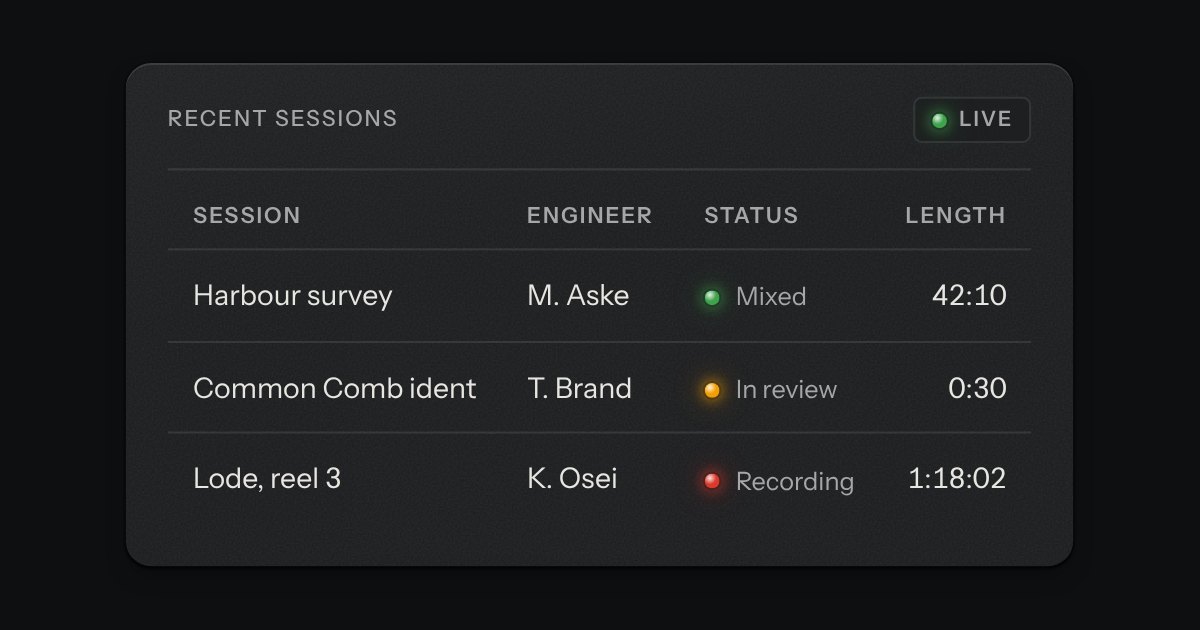
Rows of data with printed column labels, figures right-aligned in columns, and status in lamps with words.
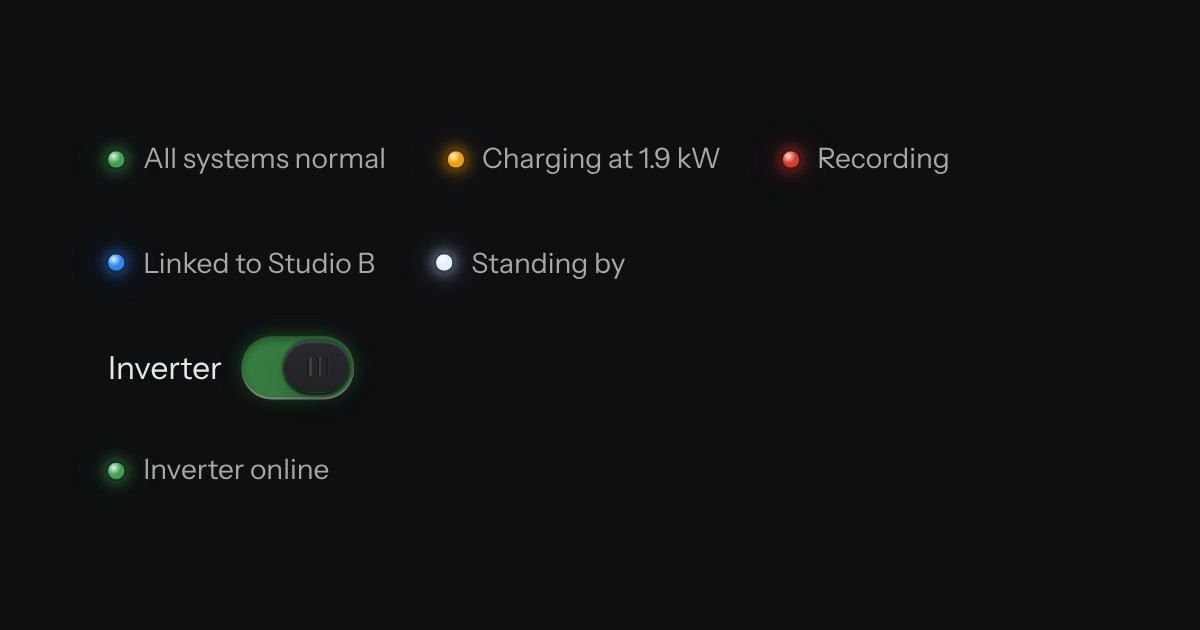
The only colour in the kit: a lamp that is on. Green is on, amber is waiting, red is recording or failing, blue is linked, white is standing by. Always next to words.
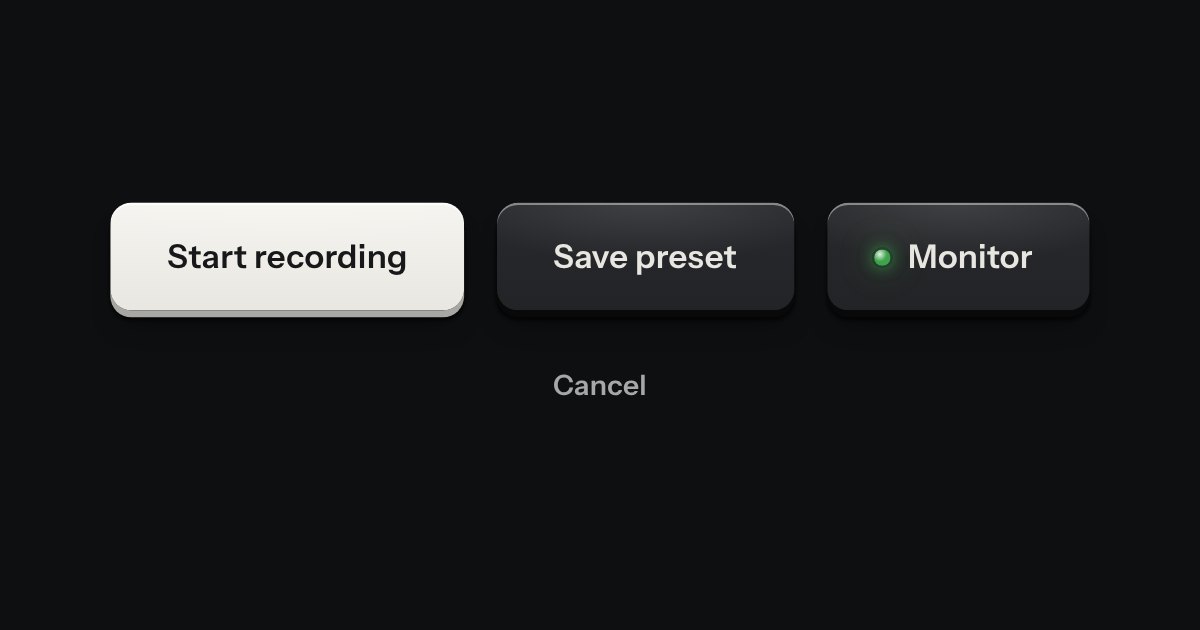
Every button, and every link that acts like one: a cap on a skirt that drops below the plate when pressed.
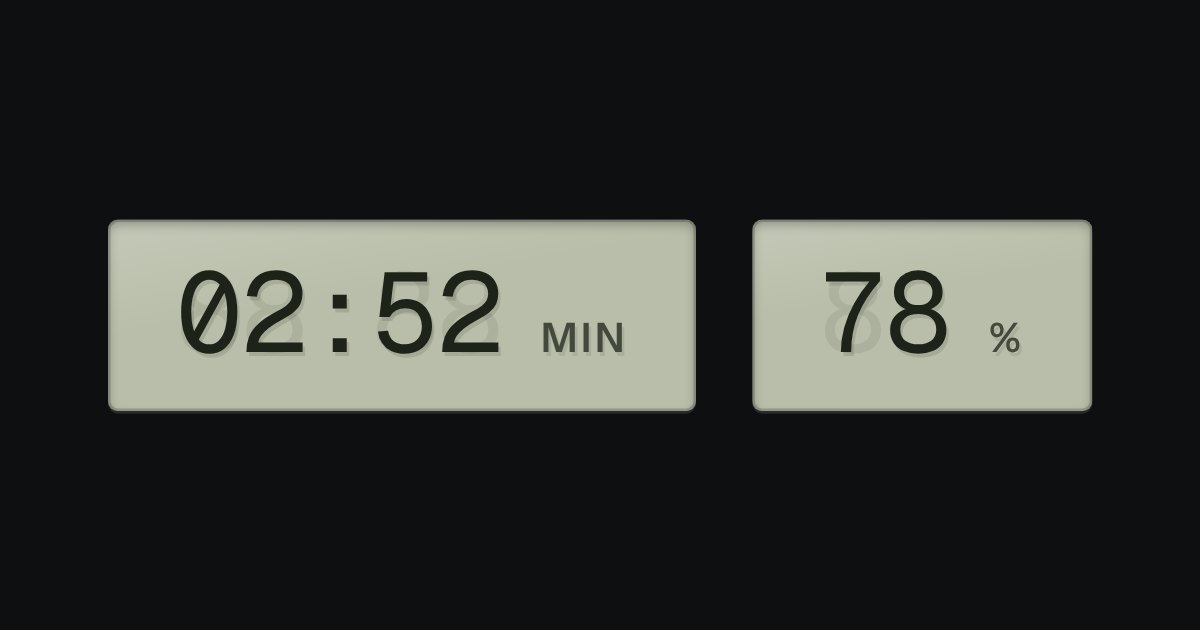
A value that changes, on grey-green liquid crystal, with a ghost of the unlit segments behind it: clocks, battery, counters.
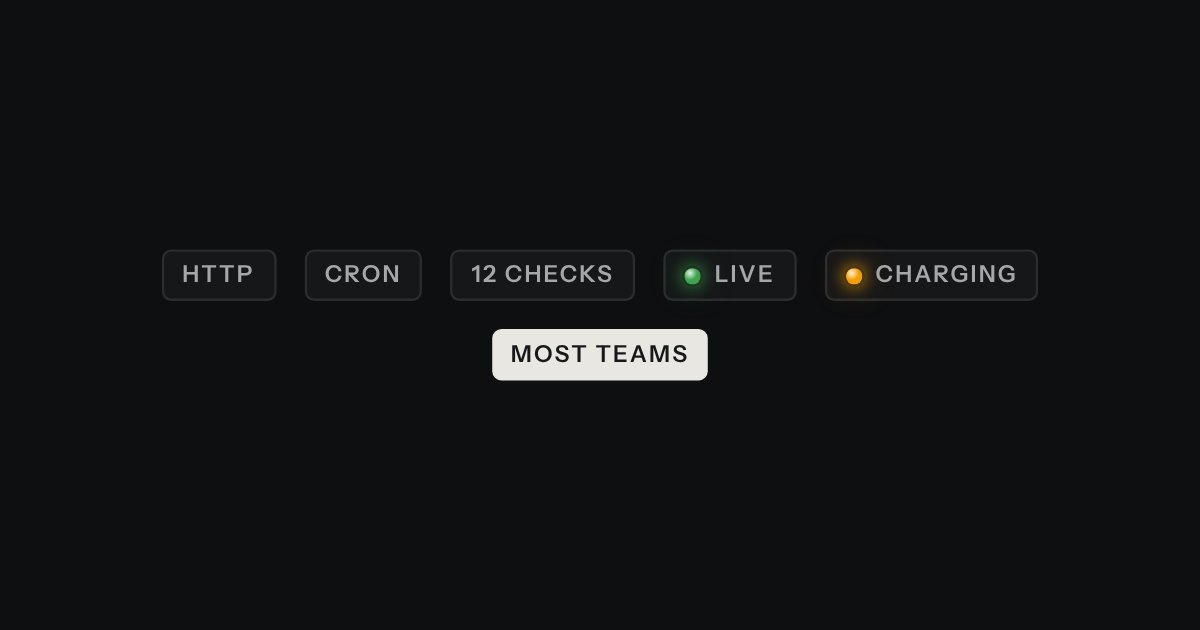
A small printed plate: a type, a count, a badge. Solid for the one tag that must stand out.
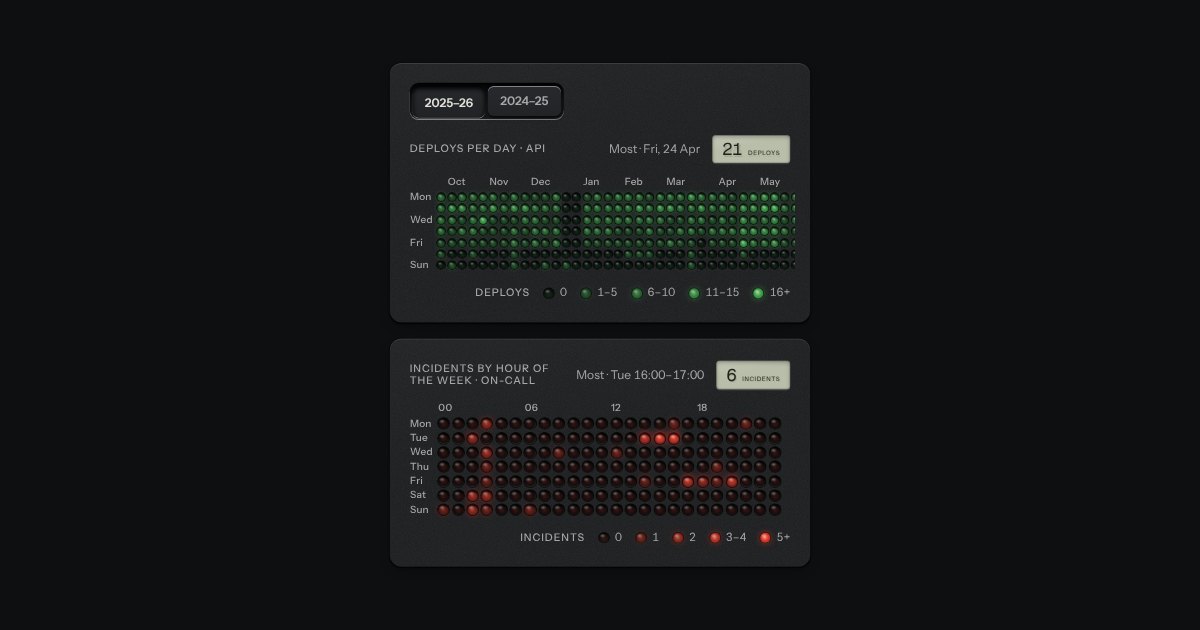
A heatmap as a matrix of small panel lamps set into the plate: each lamp’s brightness is the value, off to full in four steps, with a printed legend. Deploys per day over a year, incidents by hour of the week, energy by the hour.
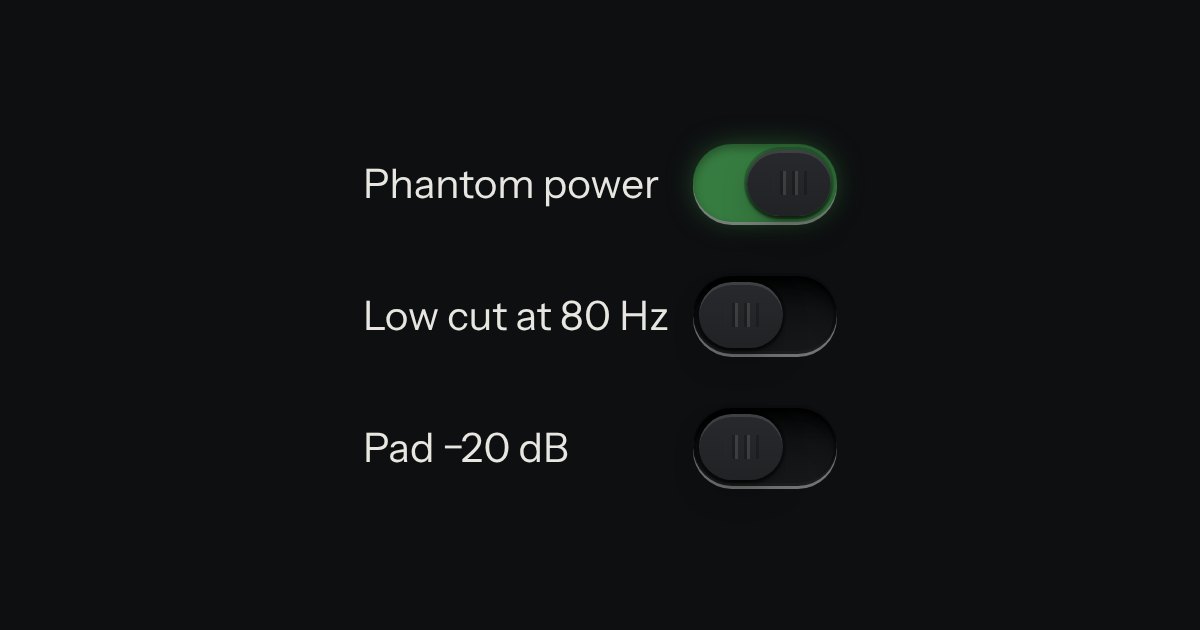
On or off, applied the moment it moves. A native checkbox with a ridged thumb in a slot that lights green when on.
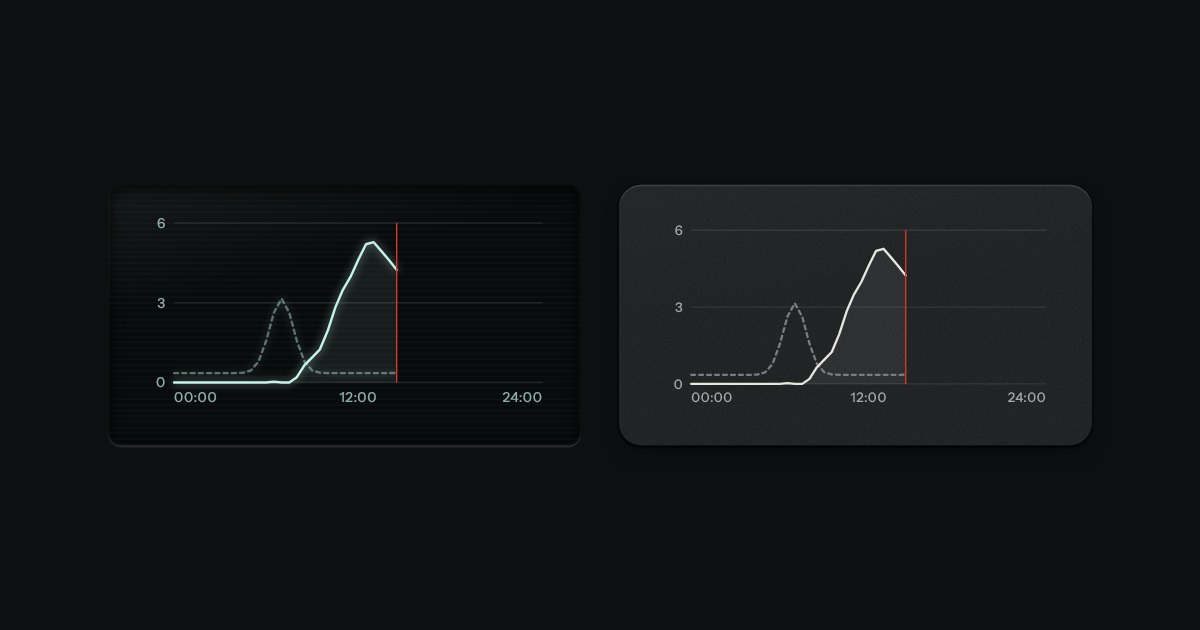
Line charts drawn as light on glass, or as ink on a panel: gridlines faint, two traces at most, a red line for now.
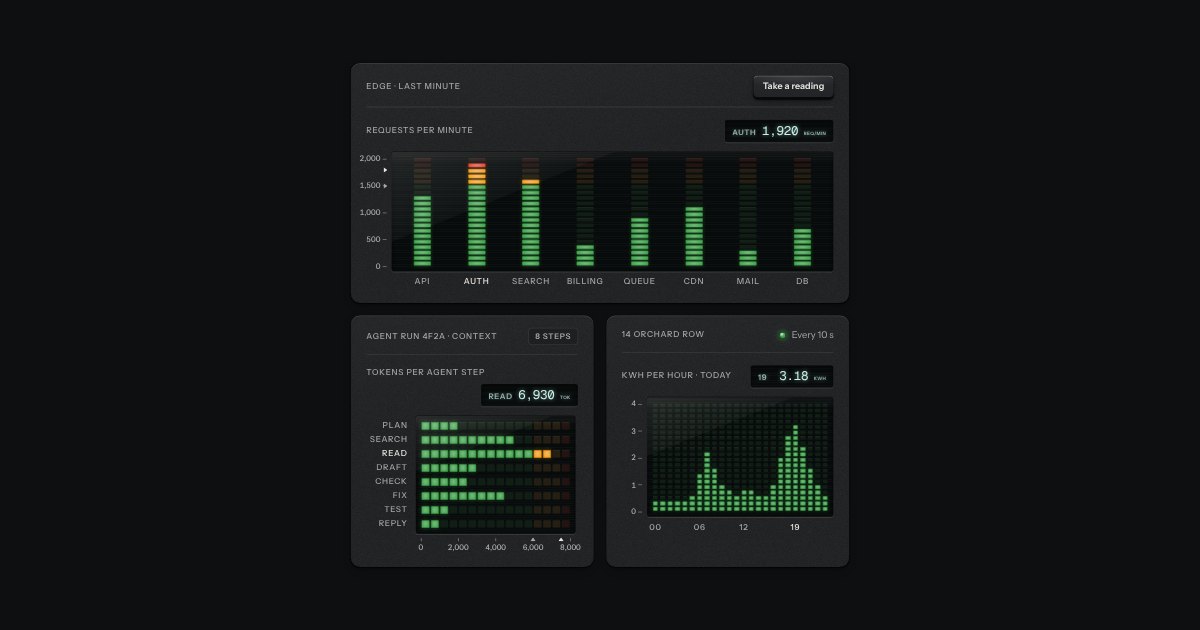
A bar chart built like a studio meter bridge: columns of LED segments behind a smoked window, green then amber then red, with a peak segment that lingers and a lit readout for the exact value.
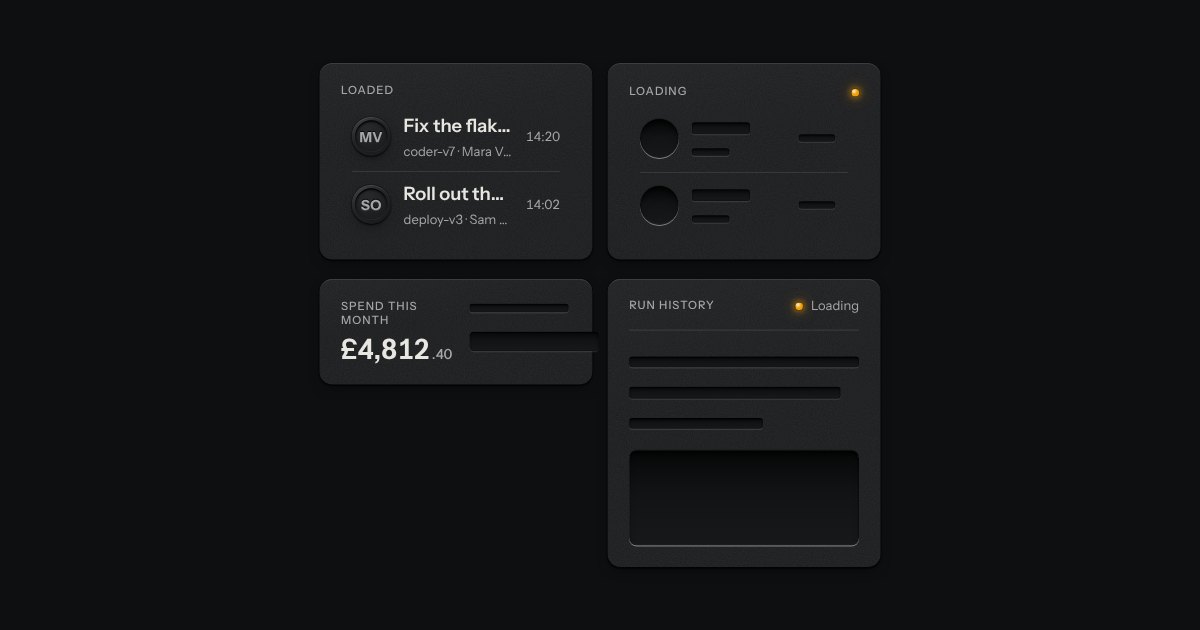
The shape of a page before its data arrives, drawn as the unprinted plate: blank engraved bars where the words will print. Nothing on it moves. One amber lamp beside “Loading” is the only sign of work.
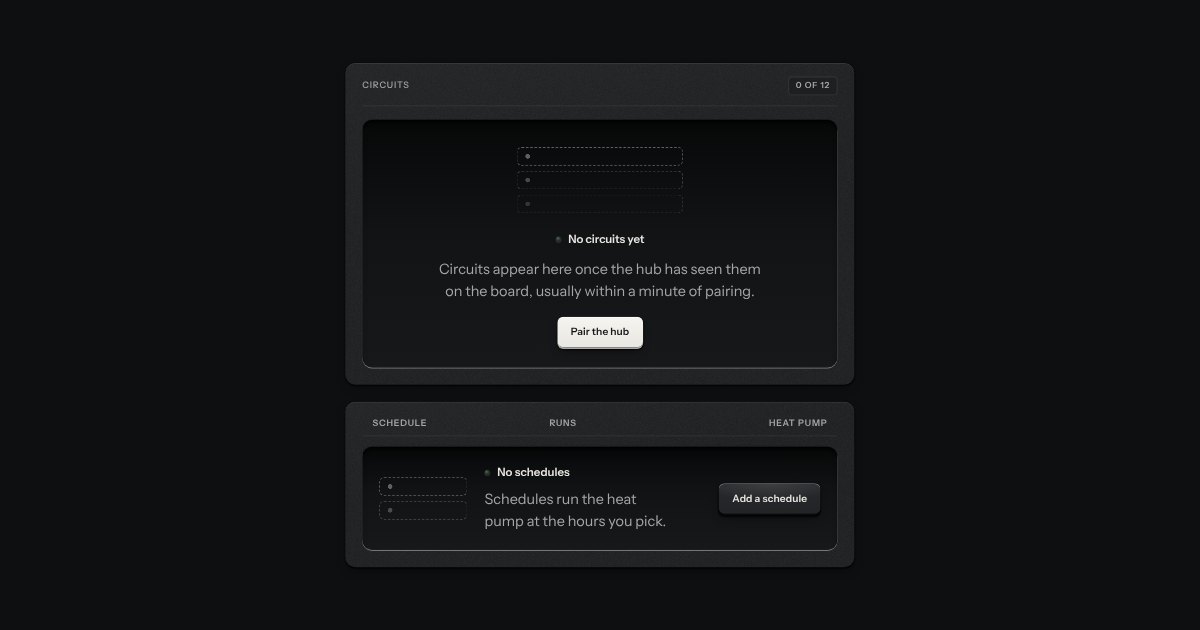
What a view shows before it has anything: an empty tray with the outline of what goes in it printed on its floor, one sentence and one key.
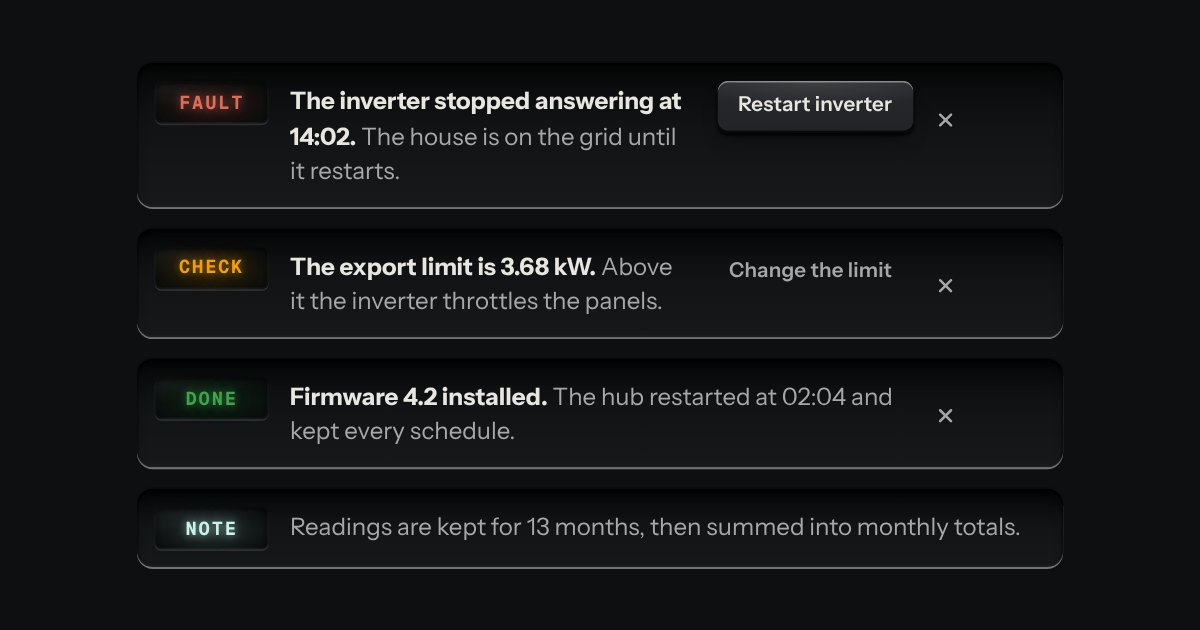
A message let into the surface, with an annunciator: a small lit legend (Note, Done, Check, Fault) beside the words that say what happened.
A bar with a numbered contents · a dateline with period and plan selectors · 01: a huge LCD over three lit readouts · 02: the cohort heatmap in the page’s one panel · 03: a plot in glass beside LED bars · 04: a sortable table · numbered notes · a key at the foot that shows the other states (?state=).