One value on each of several spokes, joined into a shape on straight-sided rings of one shared scale that starts at zero in the middle. The ring values are printed along the first spoke so a value can be read, not only compared. One or two series, lightly filled; the second has a dashed edge and square markers. Left and Right step round the spokes, Up and Down switch series. There is nothing sweeping or turning.
Seats open in 11 days. Want one email that morning?
Anatomy
Straight-sided rings and spokes in the display’s faint rule, the series laid over as lightly filled polygons in the lamps, and a ring of vertices to point at. The ring labels are drawn with a halo of the well’s own colour so they stay readable where a shape crosses them.
Variants
One series
Two series
Seven axes, a scale taken from the data
Too few axes · says so
The table shown · table
States
At rest
A vertex read
Plot focused
Props and options
Name
Kind
Description
Home · End
keyboard
Go to the first and the last axis.
Escape
keyboard
Lets go of the axis: the readout goes back to its sentence about the whole chart.
The figures to a model with one scale, the drawing at a width, the angle of a spoke, a name over two lines, and the static markup.
Usage notes
Move the pointer near a corner of a shape: the readout names the axis and the value, and a faint spoke runs to the rim. Tab onto the chart and use Left and Right round the spokes, and Up and Down to move to the other series. Turn the second series on and the dashed shape and square markers appear.
Accessibility
The plot is one tab stop; Left and Right step round the axes and Up and Down switch series, and each step is said in a polite live region (“Showers, Quay Street 9”). The same figures are in a table with a row for each axis, so the shape is never the only way to the numbers.
There is one scale for every axis, from zero at the middle, and its values are printed on the rings. The table’s caption says the scale. A value above the outer ring is drawn at the rim and said to be.
Two series differ in more than a lamp: the second has a dashed edge and square markers, and the legend shows both. A series can be hidden from the legend, which is a button with aria-pressed.
A radar needs three spokes at least; with fewer it says so in words and draws nothing, because two spokes are a line. A value below zero is drawn at zero.
Axis names are set on two lines when long and are never rotated. Nothing sweeps, spins or animates, so reduced motion has nothing to remove.
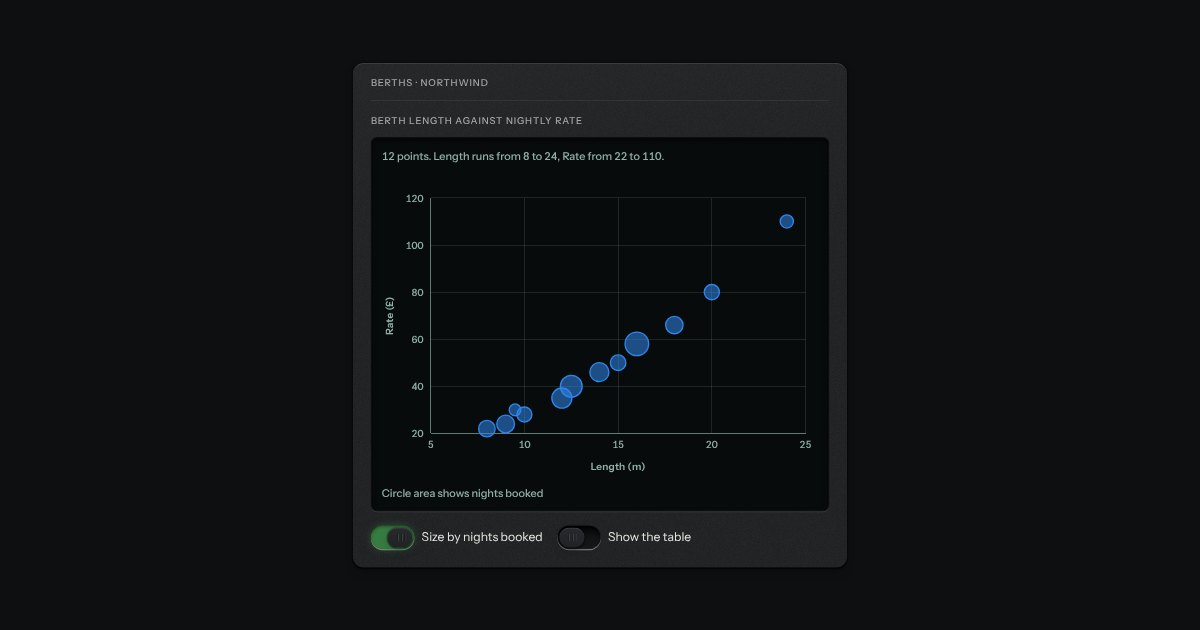
Points on two labelled scales, with a crosshair that reads the nearest point wherever the pointer is. Neither axis is forced to start at zero. Give each point a size and the circles take an area in proportion to it. With more than one series the series differ in shape as well as lamp: circle, square, triangle. Left and Right step through the points from the lowest on the horizontal axis to the highest, and the readout names each point with both values.
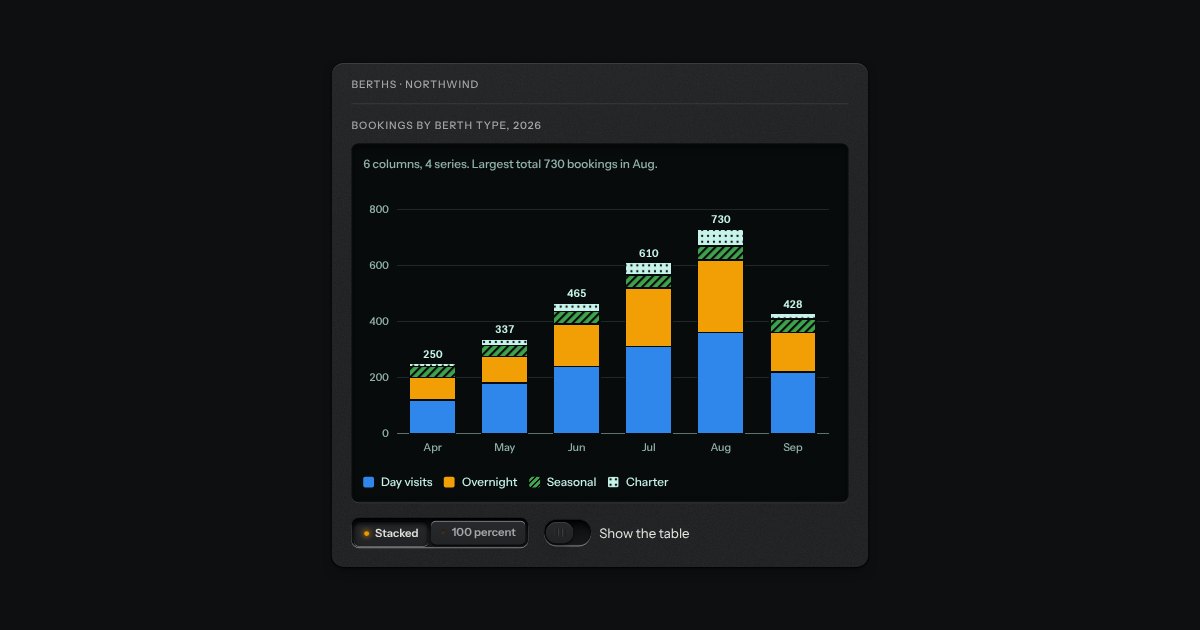
Columns split by series on a display well. Stacked mode reads totals from zero, with each total printed above its column. The series are the lamps (blue, amber, green) and the display’s own light, and from the third on they have a pattern too, so no series is only a colour. Move the pointer across the columns, or use the arrow keys, and the readout says the series, its value, its share and the total. The legend keys turn a series off and on, and the scale follows.
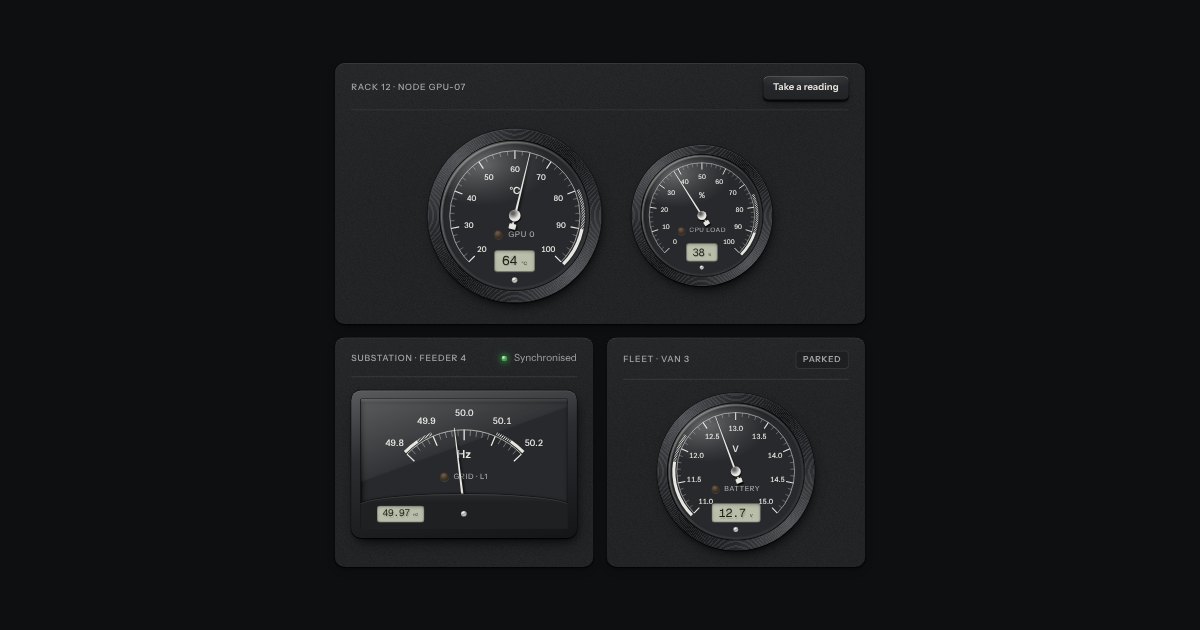
A moving-coil panel meter: a printed scale under glass, a thin needle that swings past the mark and settles, a lamp for the bands and a small LCD for the exact reading.
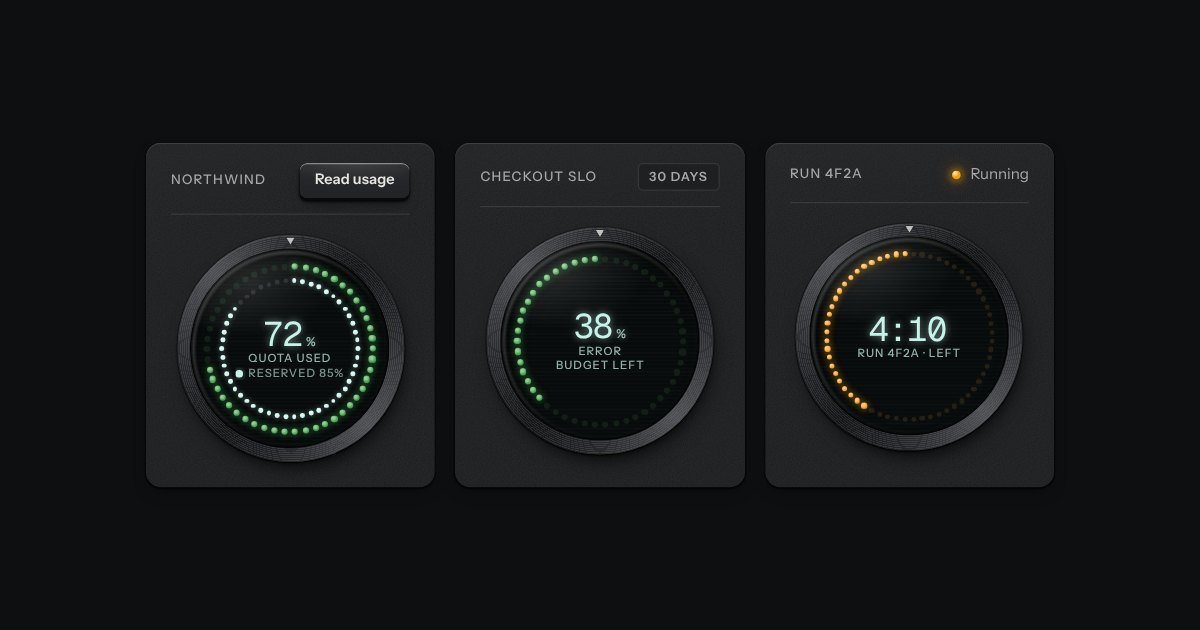
The kit’s donut chart as an instrument: a ring of lamps behind dark glass in a spun bezel, lit clockwise from twelve like a studio clock’s seconds, with the value in lit digits in the middle.