Shares of a whole as nested rectangles, each sized by its value, one level at a time. A cell that holds more has a dog-ear in its corner; click it or press Enter to open it, and the crumb above, Escape or Backspace takes you back up. A label is printed only where the cell can hold it, so a small cell stays blank rather than being cut mid-word, and every cell is still read in the readout, by the keyboard and in the table, which lists the whole tree.
Seats open in 11 days. Want one email that morning?
Anatomy
Rectangles of the blue lamp washed over the display’s glass, laid out by the squarified algorithm so cells stay close to square, with a dog-ear for a group. The label rule is a pure function of the cell’s size and the text’s length, so it is the same on the server and in the browser.
The squarified layout, what a label may hold in a cell this big, the value of a node, the model for a level, the drawing at a width, and the static markup.
Usage notes
Move the pointer over a cell for its value and share. Click a cell with a dog-ear, or Tab onto the chart, move with the arrow keys and press Enter, to open it. The crumb above, Escape and Backspace all go back up. Narrow the window and the small cells lose their labels but keep their readout.
Accessibility
The plot is one tab stop with the arrow keys moving to the nearest cell in each direction. Enter or Space opens a cell with a dog-ear and Escape or Backspace goes up; each move is said in a polite live region (“Opened Operations, 5 parts”), and the focus stays on the plot.
A cell that opens says so in words in the readout (“Holds 5 items: press Enter to open”) and has a dog-ear, a shape and not a colour.
A label is printed only where it fits whole; a name may be cut with an ellipsis only if most of it still shows, and a figure is whole or absent. A cell with no label is still reached by the pointer and the keys, and is in the table.
The table lists the whole tree, indented, with each item’s share of its parent, so a screen reader never has to drill. A cell worth nothing is left out of the drawing and kept in the table.
Cells are sized by value on a squarified layout, with a gap of glass between them. Nothing animates, so opening a level is a redraw and reduced motion has nothing to remove.
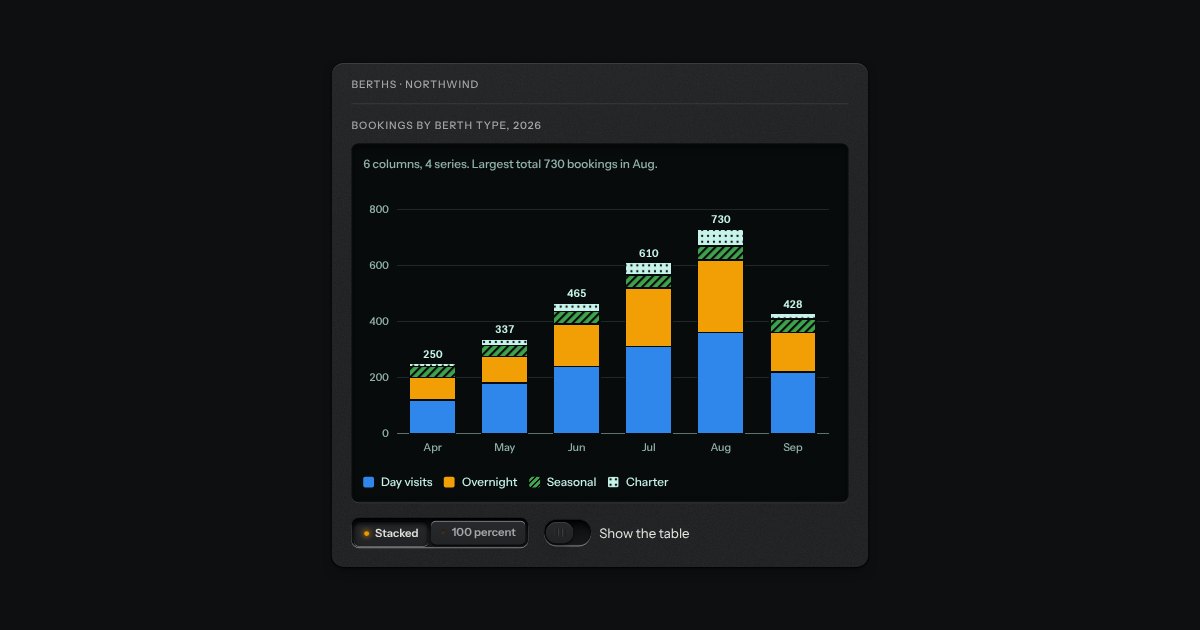
Columns split by series on a display well. Stacked mode reads totals from zero, with each total printed above its column. The series are the lamps (blue, amber, green) and the display’s own light, and from the third on they have a pattern too, so no series is only a colour. Move the pointer across the columns, or use the arrow keys, and the readout says the series, its value, its share and the total. The legend keys turn a series off and on, and the scale follows.
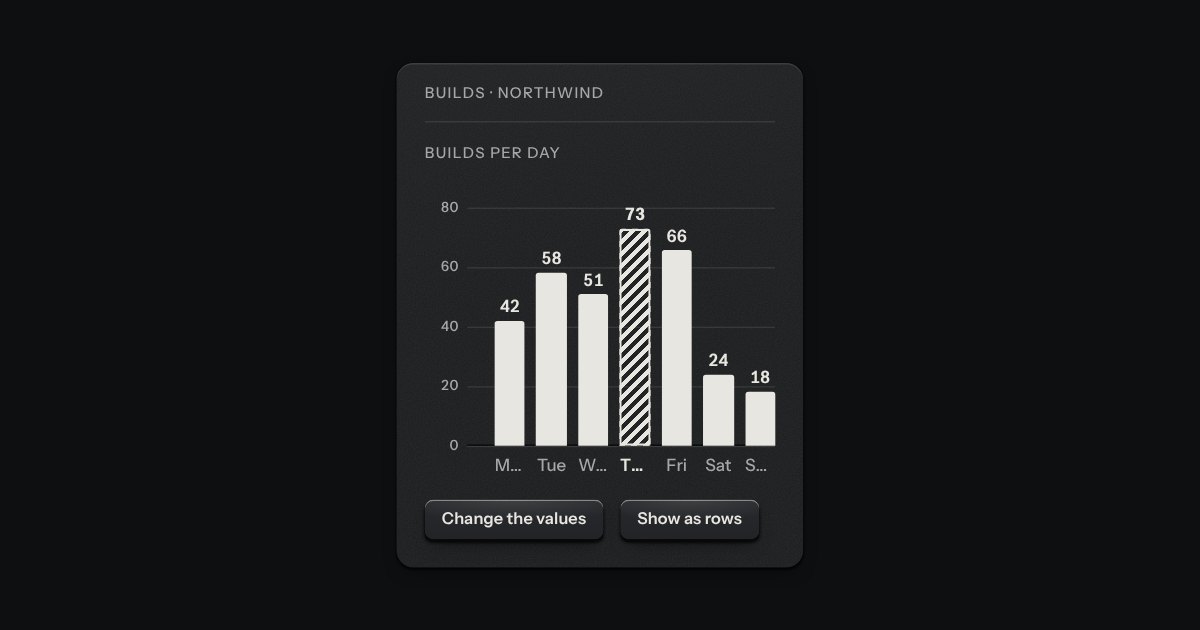
Printed bars on the panel, one value each. The bars are ink laid flat on the plate, never a colour and never glass; the axis is engraved into it, a groove along the zero line with the light on its lower lip and a faint rule at each tick. Columns by default, rows when the labels are long, and on display glass the ink is the display’s light.
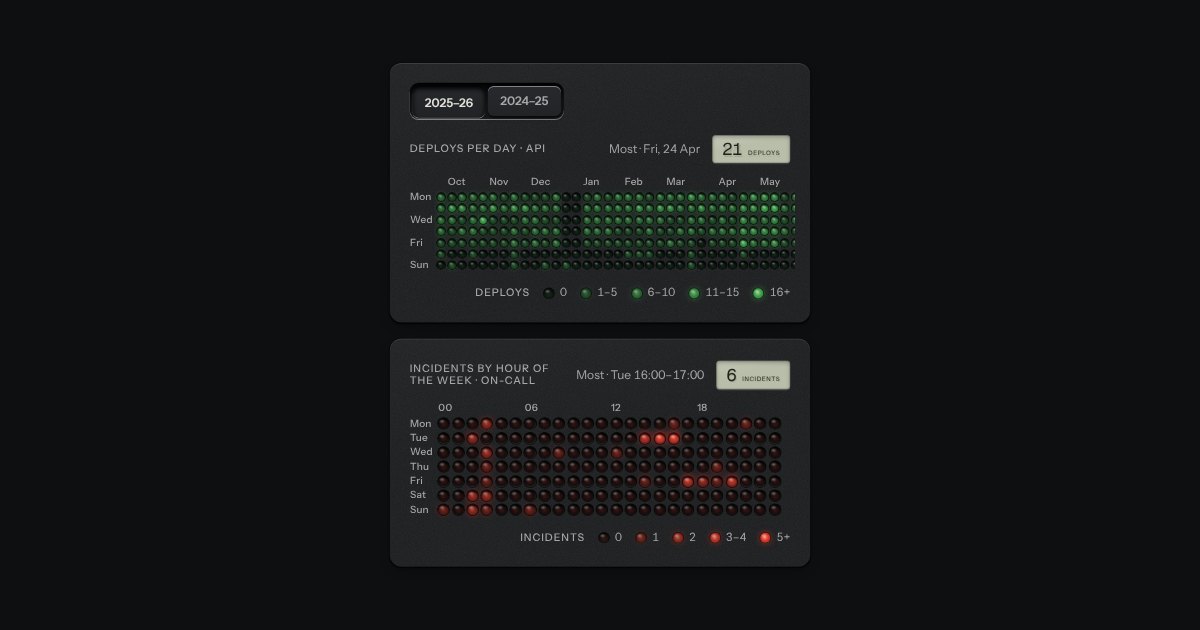
A heatmap as a matrix of small panel lamps set into the plate: each lamp’s brightness is the value, off to full in four steps, with a printed legend. Deploys per day over a year, incidents by hour of the week, energy by the hour.
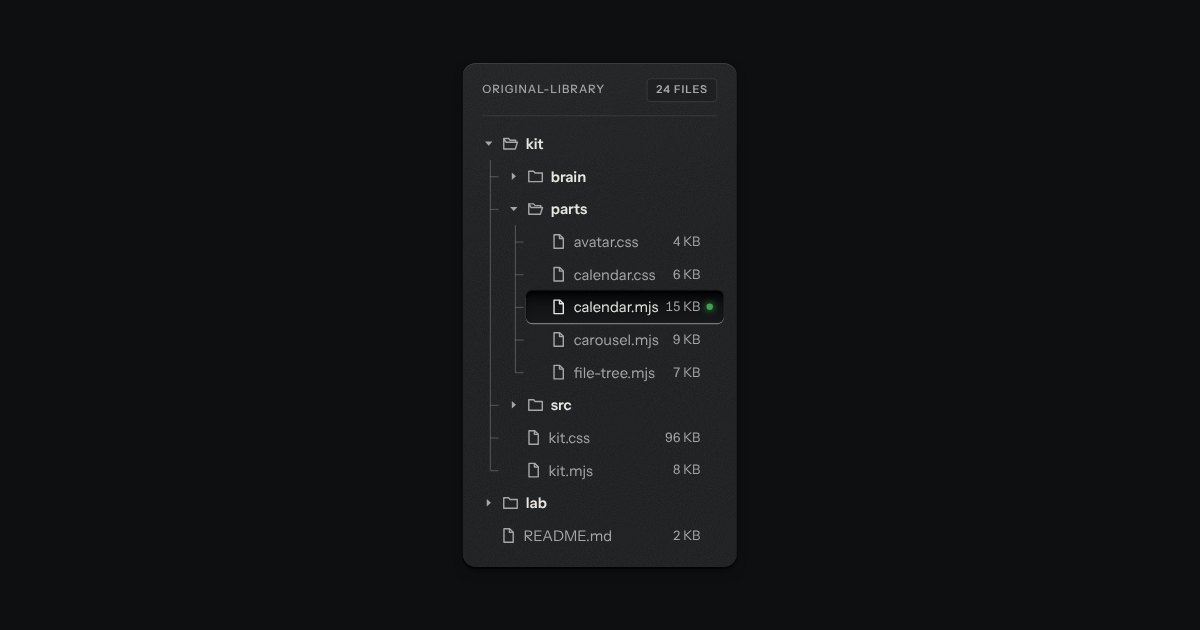
Folders and files as a real tree, printed like a wiring diagram: traces with an elbow into every item, chevrons that turn, and the chosen file set in a recess with its lamp lit. Written as a plain nested list.