Open, high, low and close for each session, with the volume traded under it, for market data. The body runs from open to close and the wick from low to high. A session that closed up has a hollow body and one that closed down a solid body, so direction does not rest on green and red alone. The price axis runs on whole steps from just under the lowest low to just over the highest high and does not start at zero; the volume strip has its own scale from zero. A crosshair reads the close and the session.
Seats open in 11 days. Want one email that morning?
Anatomy
Bodies and wicks drawn on pixel boundaries so a one-pixel wick is crisp, a volume strip sharing the same columns, and the display well’s grid behind. Up is hollow and down is solid, which survives a greyscale print.
Variants
One month with volume
Three months · thinner candles
Without volume
The table shown · table
States
At rest
A session read
Plot focused
Props and options
Name
Kind
Description
Home · End
keyboard
Go to the first and the last session.
Escape
keyboard
Lets go of the session: the readout goes back to its sentence about the whole chart.
The sessions cleaned and checked, the model with the price and volume scales, the drawing at a width, and the static markup.
Usage notes
Move the pointer along the chart: the crosshair stands on the nearest session and the readout gives open, high, low, close, the change and the volume. Tab onto the chart and use Left and Right from session to session. Switch to three months to see sixty sessions drawn thinner.
Accessibility
The plot is one tab stop; Left and Right step session by session and each step is said in a polite live region with open, high, low, close, the change and the volume. A real table lists every session with the same figures.
Direction is never only a colour: a session that closed up has a hollow body and one that closed down a solid body, the key shows both, and the readout and the table say “up” or “down” and the change in percent.
The price axis does not start at zero, as a price chart is read, and the table’s caption says so. It runs on whole steps from below the lowest low to above the highest high. The volume strip has its own scale from zero, printed at its left.
A high or low that does not hold the open and close is widened to hold them and the table marks the row; a session with a missing figure is left out of the drawing rather than drawn wrong.
Candles thin out with the number of sessions down to a single pixel, and the date labels thin to fit, never overlapping. The crosshair reads the nearest session by column, so a thin candle is not a small target. Nothing animates.
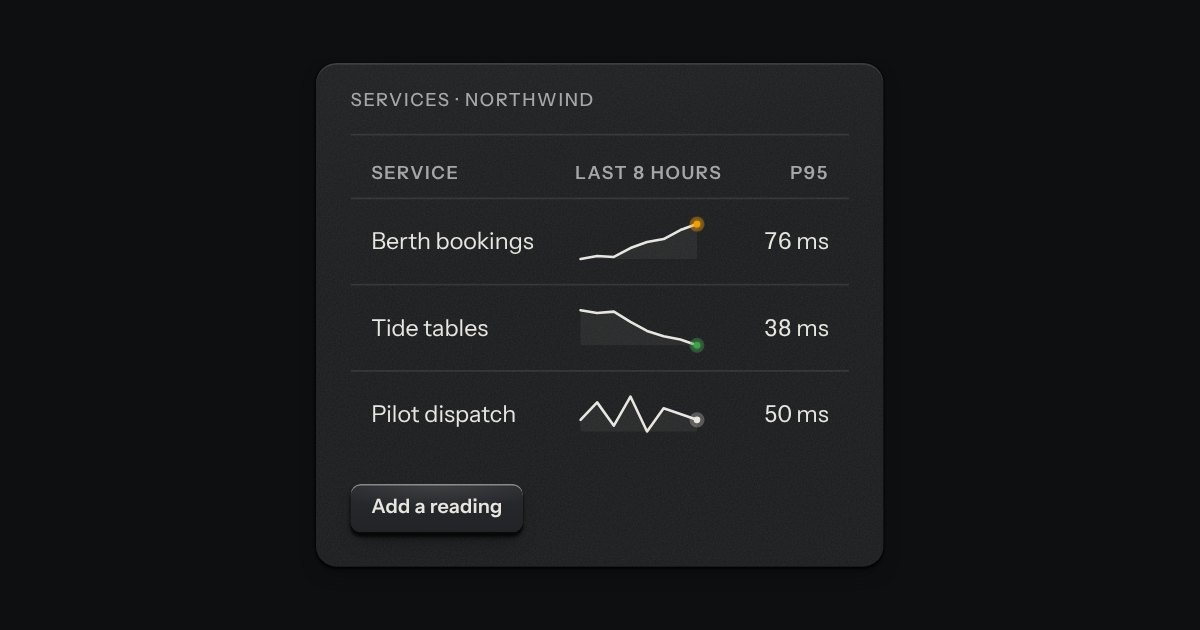
A word-sized line for the margin of a table or beside a readout. It is an SVG that takes the size of the type around it and the ink of the place it sits in, so on a panel it is ink and on display glass it is the display’s light. The last value is marked with a dot seated in a faint ring, and a lamp lights the dot when the reading matters. The trend and the last value are said in words on the image’s label, so the line is a second sign and never the only one.
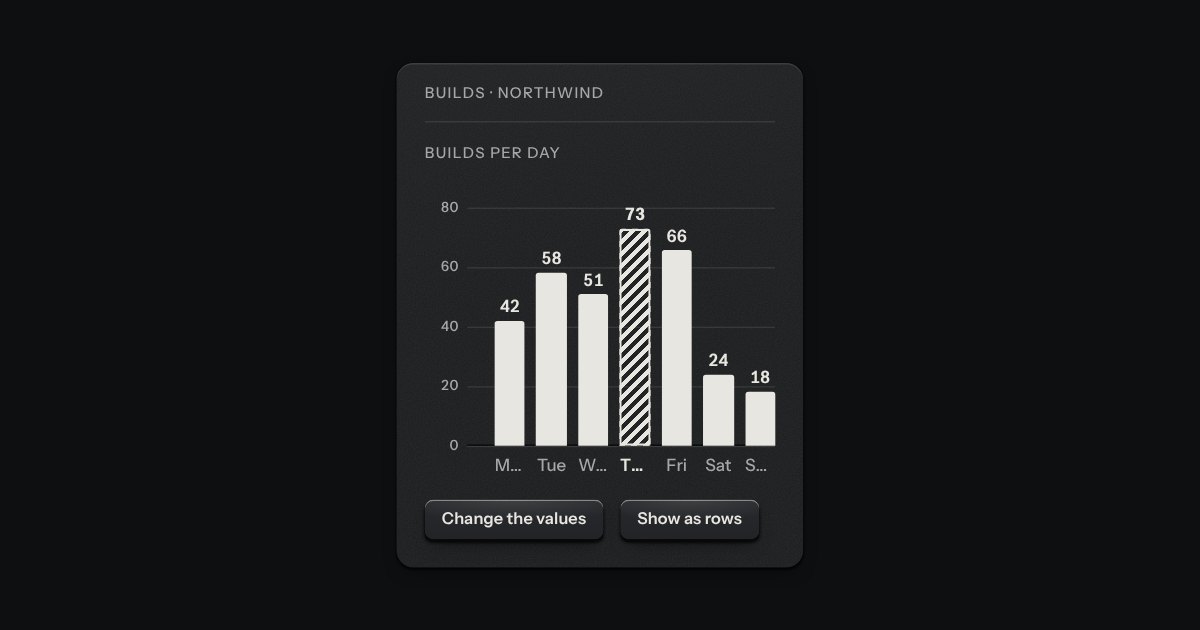
Printed bars on the panel, one value each. The bars are ink laid flat on the plate, never a colour and never glass; the axis is engraved into it, a groove along the zero line with the light on its lower lip and a faint rule at each tick. Columns by default, rows when the labels are long, and on display glass the ink is the display’s light.
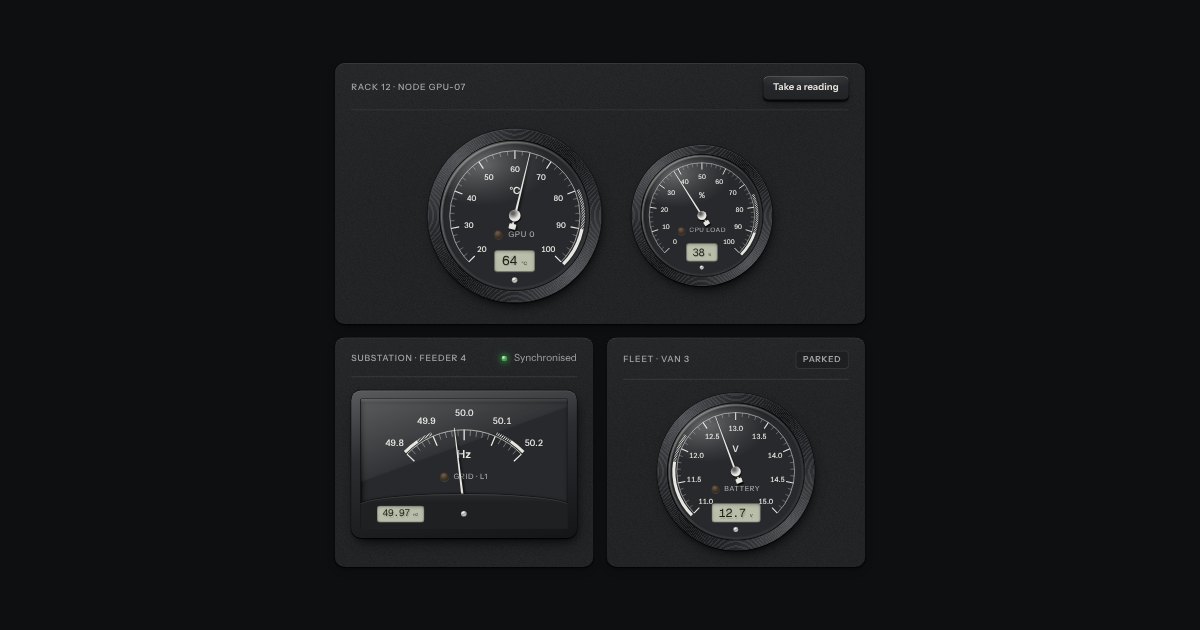
A moving-coil panel meter: a printed scale under glass, a thin needle that swings past the mark and settles, a lamp for the bands and a small LCD for the exact reading.