Gains and losses stepping from a start to a total. Each change floats from where the running figure was to where it lands, and a total stands on the zero line. A gain is a solid green bar with its figure above it and a plus; a loss is a hatched red bar with its figure below it and a minus, so direction reads with the colour taken away. Thin dashed steps join the bars at the running figure, and the scale takes in zero and every running figure, so a run that dips below zero is drawn below the line.
Seats open in 11 days. Want one email that morning?
Anatomy
Bars floated between running figures on the display well, with a hatched pattern for a loss and a dashed step between neighbours. The totals are never typed in: the chart adds the steps itself, which is what makes it safe to read as an account.
Variants
Start, changes and a total
A run that dips below zero
Four bars
The table shown · table
States
At rest
A loss read
Plot focused
Props and options
Name
Kind
Description
Home · End
keyboard
Go to the first and the last bar.
Escape
keyboard
Lets go of the bar: the readout goes back to its sentence about the whole chart.
The running figures, the model with the scale, the drawing at a width, a name over two lines, and the static markup.
Usage notes
Move the pointer along the bars: the readout gives the step, the change, and the running figure before and after. Gains are solid with a plus above; losses are hatched with a minus below. Tab onto the chart and use Left and Right. The cash variant dips below zero to show a negative run.
Accessibility
The plot is one tab stop. A real table gives each step’s kind, change and running figures, so the arithmetic can be checked without the picture.
Gain and loss are never only a colour: a gain is a solid fill with a plus and its figure above the bar, a loss is hatched with a true minus sign and its figure below, and the key shows both. A total or start is the display’s own light.
The scale takes in zero and every running figure and runs on whole steps, so a run that goes negative is drawn below the zero line with the axis to match. Totals are worked out from the steps; if a total is given and differs, the readout says by how much.
Bar figures are printed when there is room and left off when there is not, and are always in the readout. Names are set on two lines when long and cut with an ellipsis when still too long.
Nothing animates; the dashed steps and the hatching are drawn once.
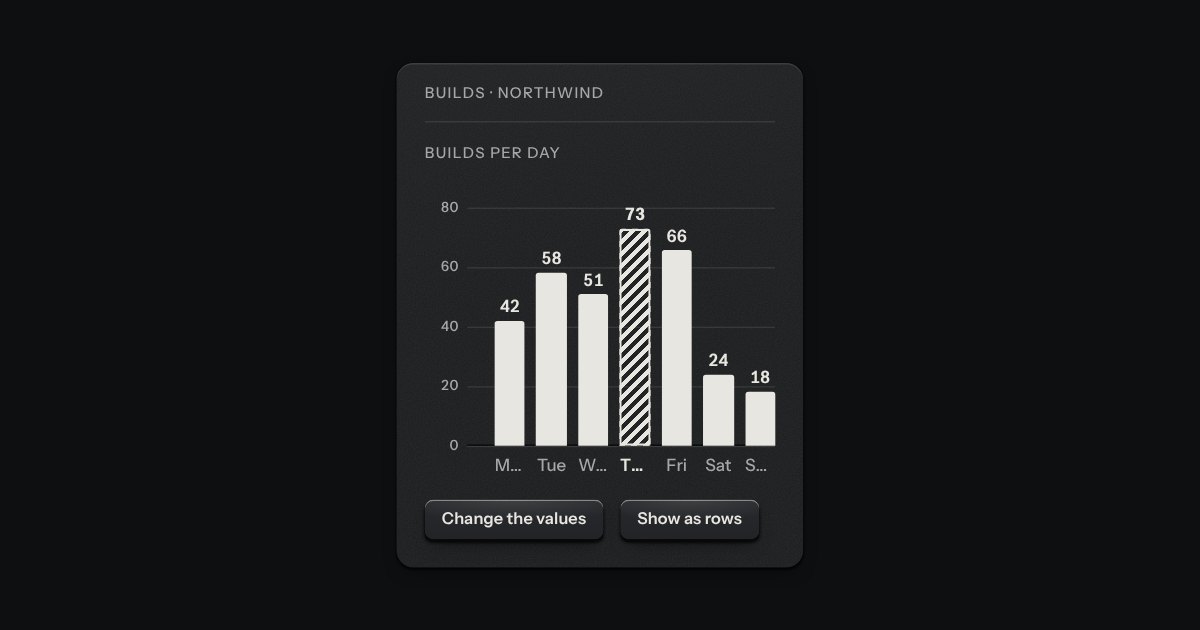
Printed bars on the panel, one value each. The bars are ink laid flat on the plate, never a colour and never glass; the axis is engraved into it, a groove along the zero line with the light on its lower lip and a faint rule at each tick. Columns by default, rows when the labels are long, and on display glass the ink is the display’s light.
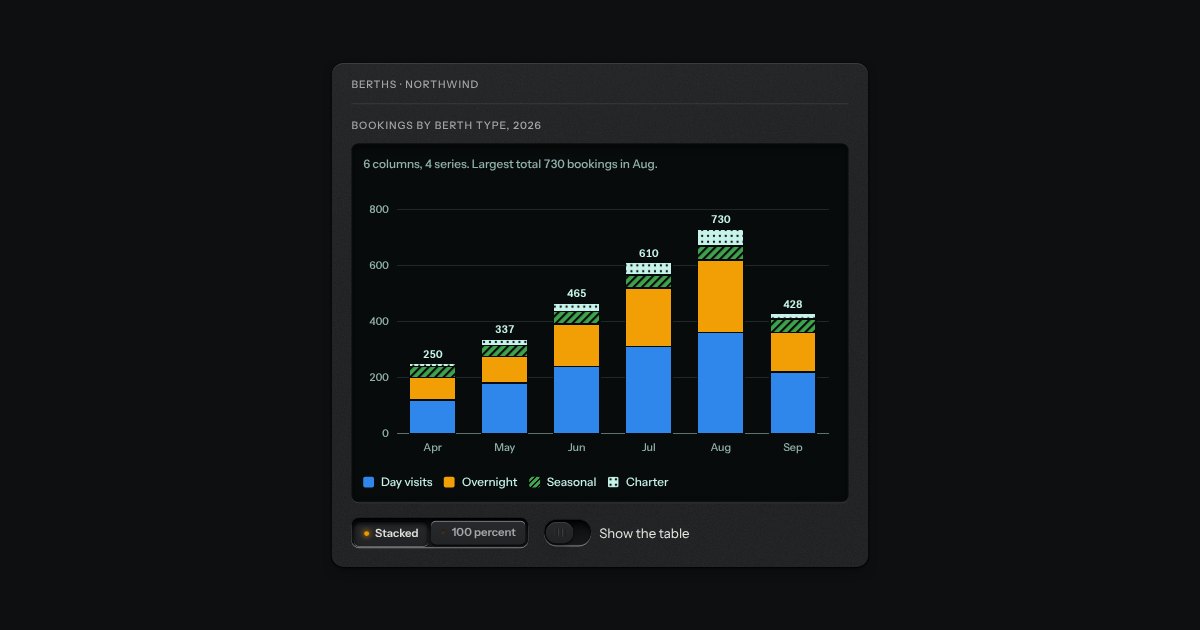
Columns split by series on a display well. Stacked mode reads totals from zero, with each total printed above its column. The series are the lamps (blue, amber, green) and the display’s own light, and from the third on they have a pattern too, so no series is only a colour. Move the pointer across the columns, or use the arrow keys, and the readout says the series, its value, its share and the total. The legend keys turn a series off and on, and the scale follows.
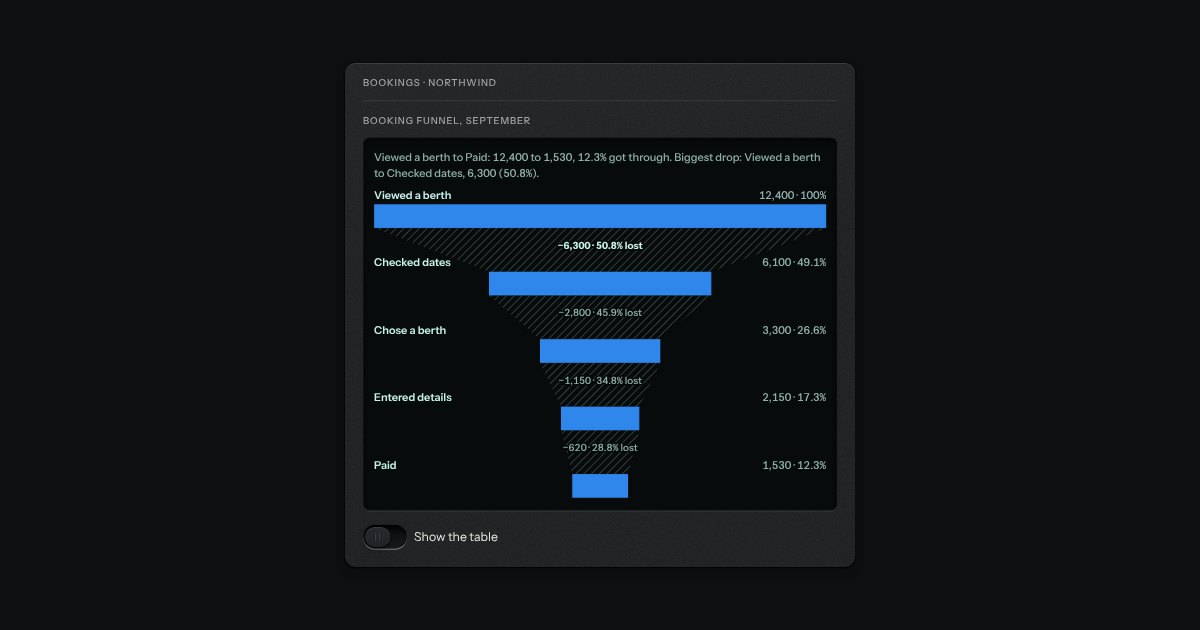
The stages of a process in order, each as wide as how many got that far, centred and to scale, with the drop-off written between each pair: the number lost and its share of the stage before. Every stage prints its count and its share of the first. The biggest drop is set in bold. A later stage larger than the one before is drawn to scale and said to be a gain, never hidden.
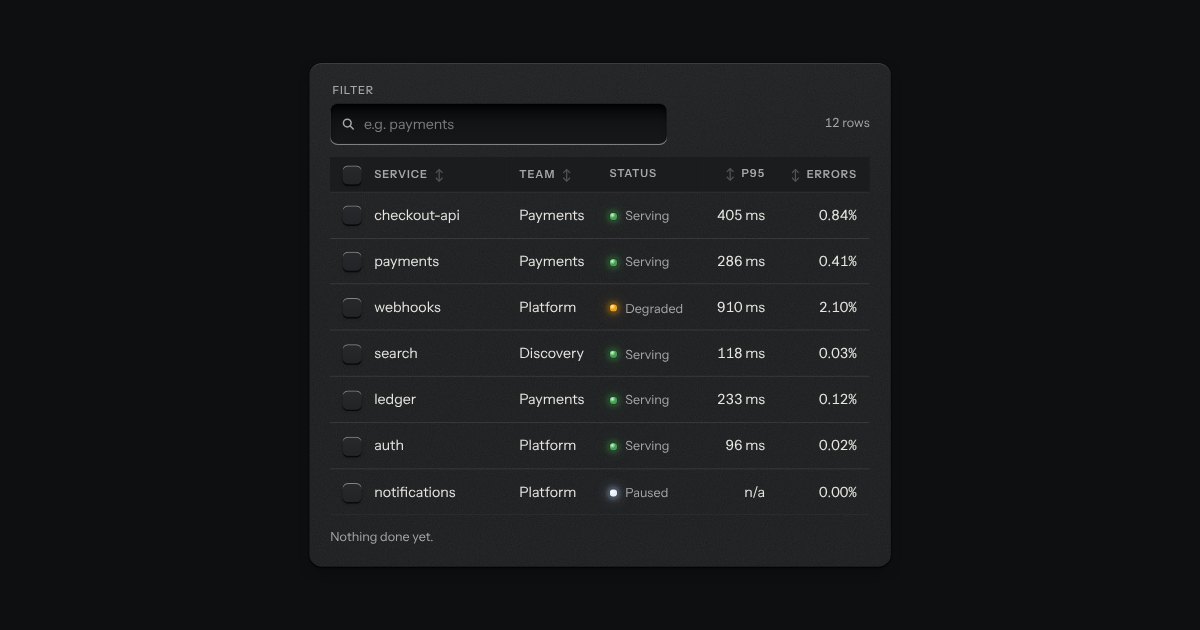
The kit’s table with the tools a working one needs: headers that sort, a filter well, a check key on every row with one in the header that selects them all and sinks half way when only some are chosen, and a header that stays at the top while the rows scroll under it. While rows are chosen a plate slides out of a slot under the tools, its lamp lit, carrying what can be done to them. Without the script it is the plain table.