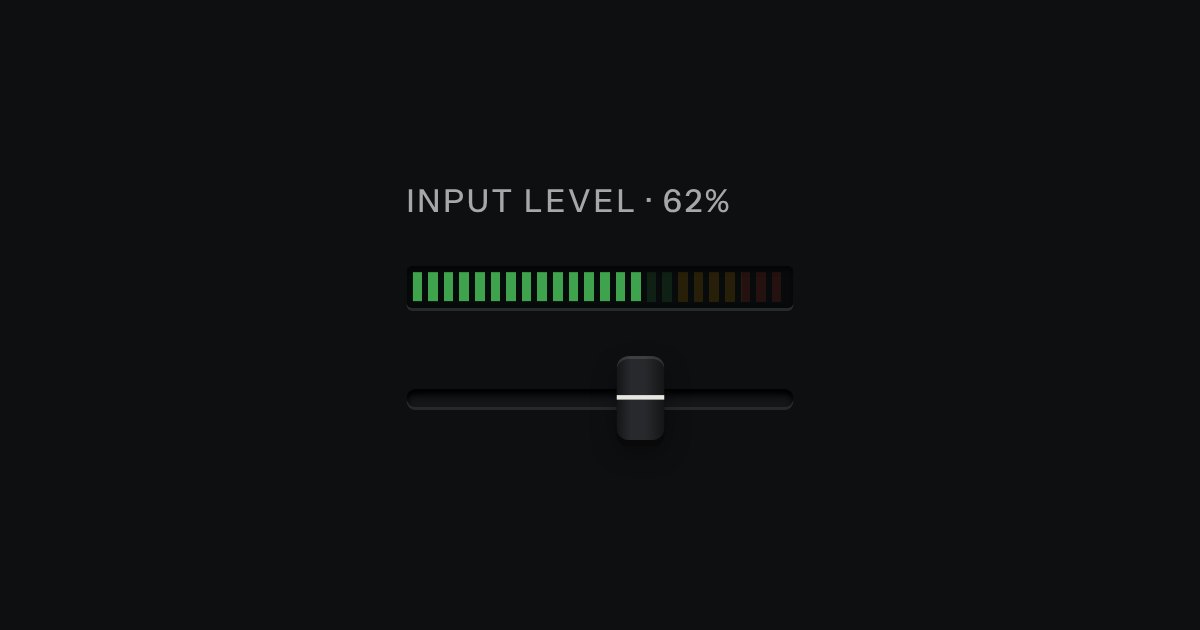
Ladder
An LED ladder for levels and load: green, then amber, then red, the way a recording level has always been read.
Kit parts
A bar chart built like a studio meter bridge: columns of LED segments behind a smoked window, green then amber then red, with a peak segment that lingers and a lit readout for the exact value.
Seats open in 11 days. Want one email that morning?
A custom element that writes plain DOM. The lit layer is a pseudo-element with a hot centre and a glow in the segment’s own colour. The window is the kit’s display glass with its glare fixed over the columns. The loop runs only while a column moves. Names are measured on a canvas once per width, so thinning them costs no layout.
| Name | Kind | Description |
|---|---|---|
| values · labels | attribute | The readings and their names, in column order. Changing values animates; changing labels sets new columns. |
| label | attribute | Printed as the title and the name of the group: “Requests per minute”. |
| min · max | attribute | The scale. Values past it pin the bar at the end and say so in words. |
| warn · alarm | attribute | Where the segments turn amber and red, and the wedges on the scale. Alarm under warn means low is bad (a battery, a budget). |
| lamp | attribute | The one colour when there is no warn or alarm. |
| segments | attribute | Segments per bar. |
| peak | attribute | |
| unit · unit-text | attribute | The unit on the readout, and as it is read out. |
| decimals | attribute | Decimals on the readout and in the words. |
| orient | attribute | Columns stand up or lie down. Auto lies them down when the names do not fit under their columns. |
| label-every | attribute | Print every nth name: 3 for the hours of a day. Auto thins the names only as much as they need. |
| active | attribute | |
| data-state | attribute | Written by the part: running only while a column moves. |
| Tab | keyboard | Enters the chart on the last column you were on, the first at the start. |
| ← → · ↑ ↓ · Home · End | keyboard | Move between columns; the readout shows the one with focus. |
| Point · touch | pointer | The readout shows the column under the pointer or finger; leaving puts back the focused or the highest. |
Take a reading: bars rise fast and fall slowly, and the peak segment lingers. Point at a column, or Tab in and use ← →, to read it on the display.
An LED ladder for levels and load: green, then amber, then red, the way a recording level has always been read.
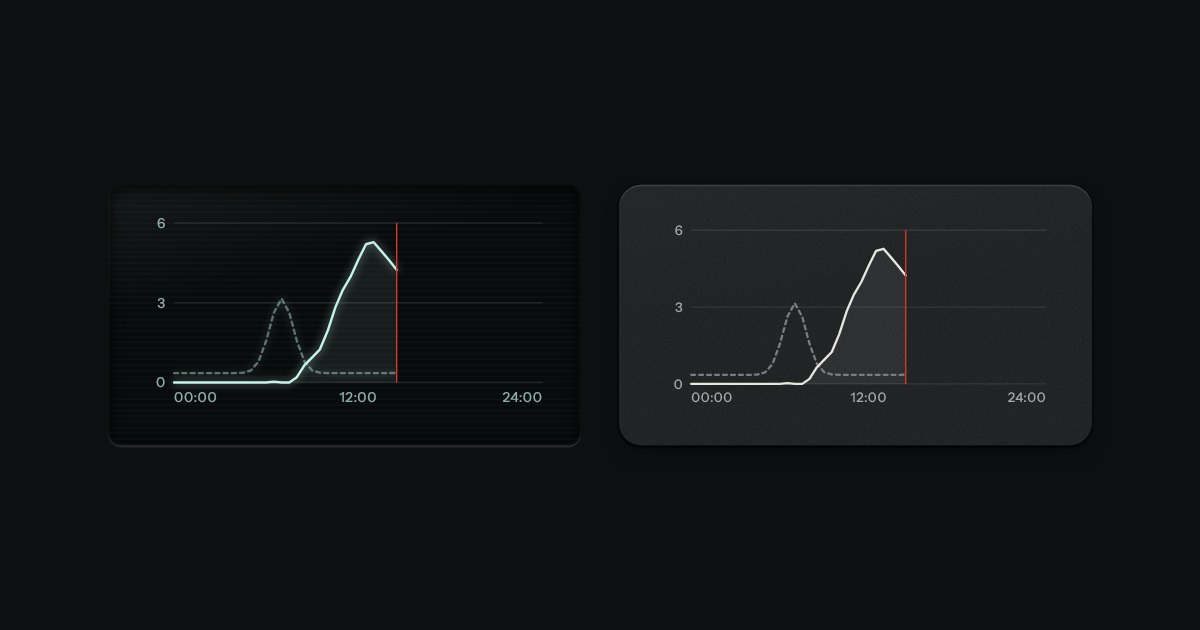
Line charts drawn as light on glass, or as ink on a panel: gridlines faint, two traces at most, a red line for now.
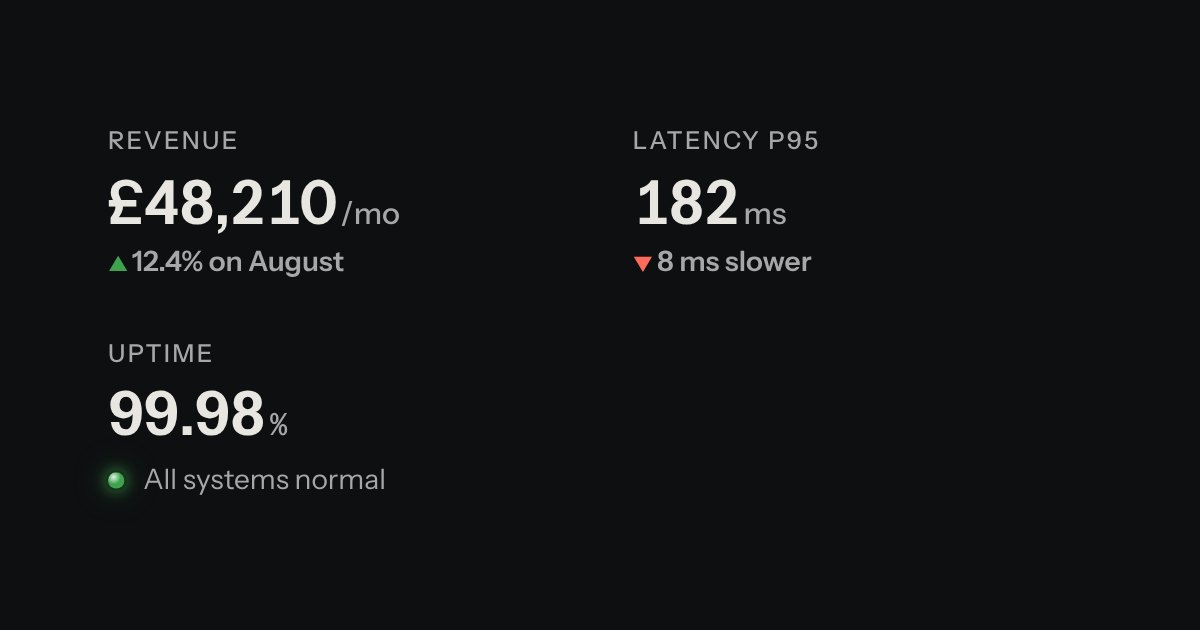
A printed label over a value: key figures, with the unit small and the change in words.