Columns split by series on a display well. Stacked mode reads totals from zero, with each total printed above its column. The series are the lamps (blue, amber, green) and the display’s own light, and from the third on they have a pattern too, so no series is only a colour. Move the pointer across the columns, or use the arrow keys, and the readout says the series, its value, its share and the total. The legend keys turn a series off and on, and the scale follows.
Seats open in 11 days. Want one email that morning?
Anatomy
A display well of dark glass with the series as the lamps laid in as columns, a gap of glass between each segment so neighbours never run together. The element is a few dozen lines on the frame the seven wave 5d charts share: it draws to the width it has, so type and strokes stay the size they are, and it redraws when the width changes.
The figures to a model, the model to a drawing at a width, and the whole chart as static markup.
Usage notes
Move the pointer across the columns: the segment under it is ringed and the readout names its series, value, share and column total. Tab onto the chart and use Left and Right between columns and Up and Down between series.
Accessibility
The picture is hidden from a screen reader, which is given the same figures in a real table after the chart: a caption, a column for each series and a total.
A series is never only a colour. They are the lamps in a fixed order, and from the third on each has a pattern (diagonal, dots, stripes) that the legend swatches repeat; the readout and the table name the series in words.
The scale starts at zero and is cut on whole steps of 1, 2 or 5.
The readout holds two lines whether or not it has anything to say, so the chart does not jump as the pointer moves, and it is the same words the live region says. On a touch screen a press reads the column under the finger, and the chart still lets the page scroll up and down.
Nothing animates, so reduced motion has nothing to remove.
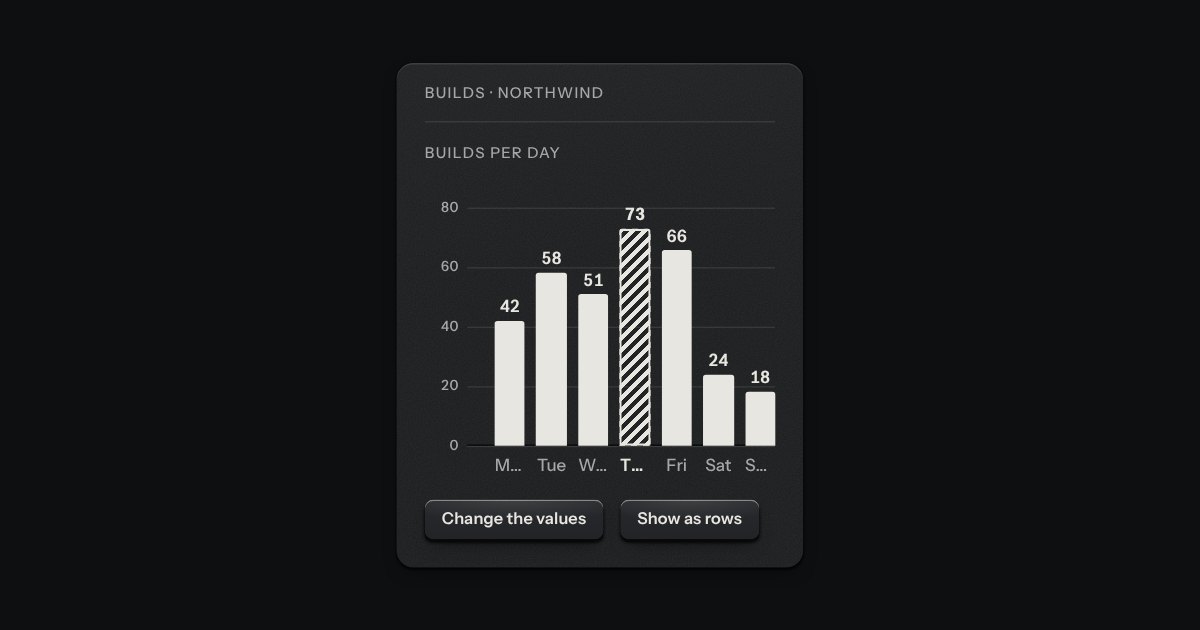
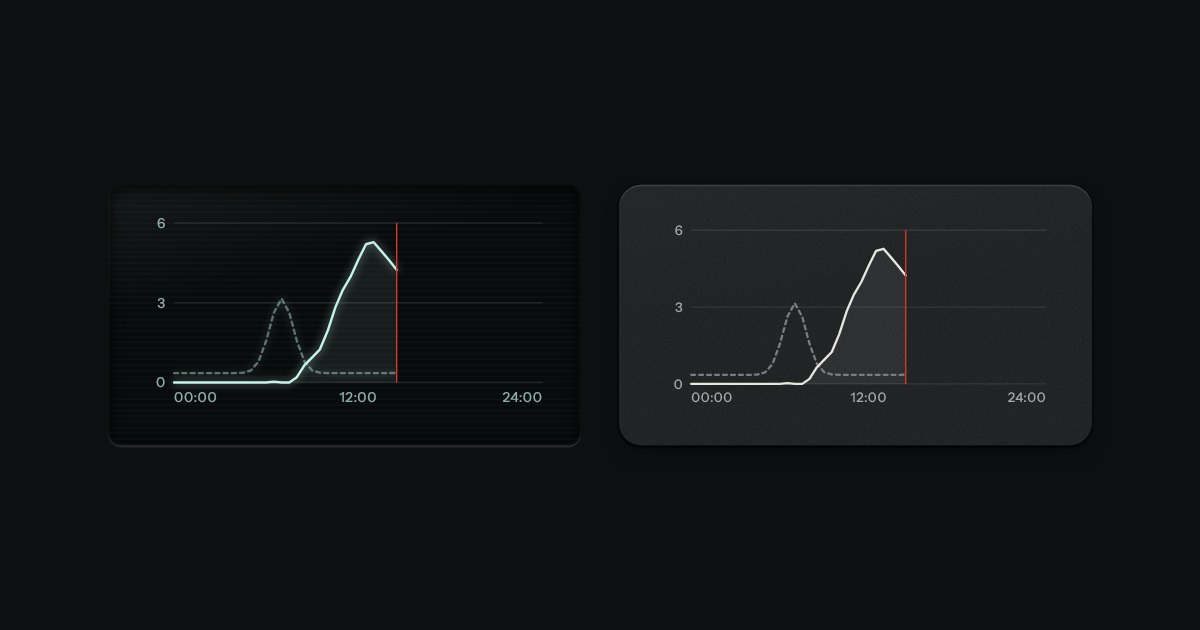
Printed bars on the panel, one value each. The bars are ink laid flat on the plate, never a colour and never glass; the axis is engraved into it, a groove along the zero line with the light on its lower lip and a faint rule at each tick. Columns by default, rows when the labels are long, and on display glass the ink is the display’s light.
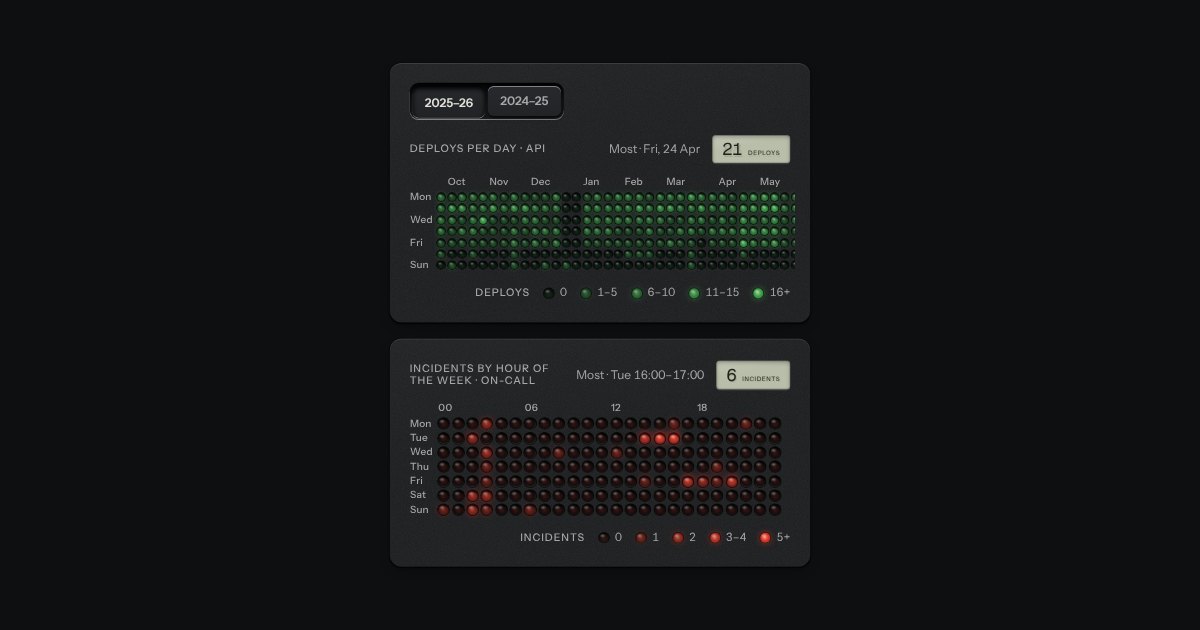
A heatmap as a matrix of small panel lamps set into the plate: each lamp’s brightness is the value, off to full in four steps, with a printed legend. Deploys per day over a year, incidents by hour of the week, energy by the hour.
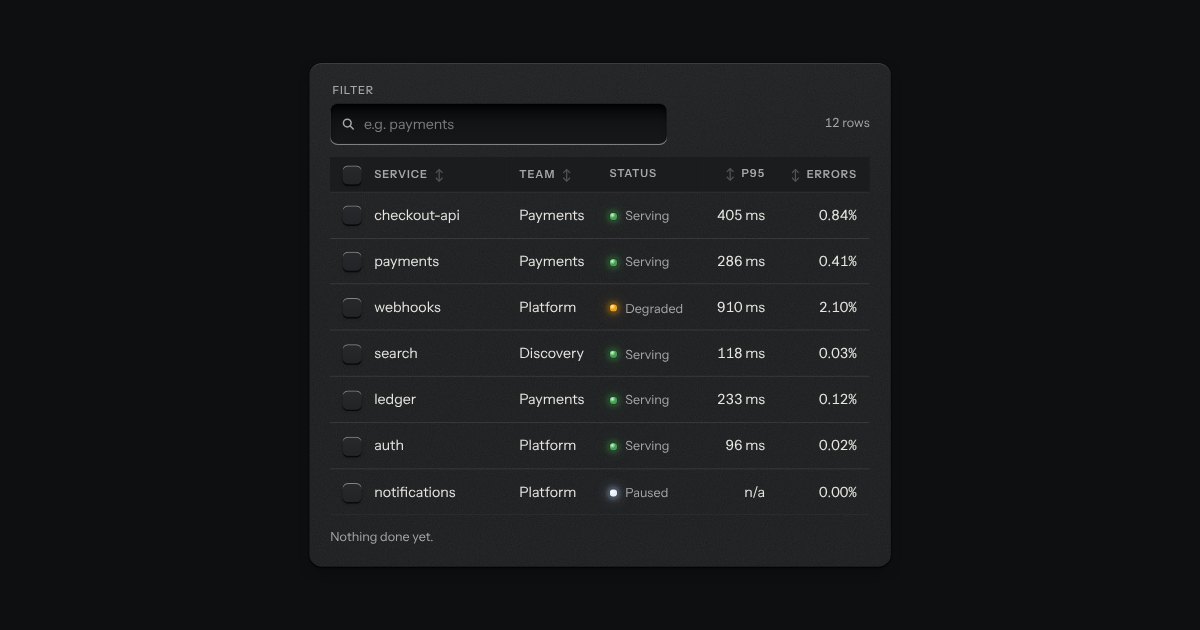
The kit’s table with the tools a working one needs: headers that sort, a filter well, a check key on every row with one in the header that selects them all and sinks half way when only some are chosen, and a header that stays at the top while the rows scroll under it. While rows are chosen a plate slides out of a slot under the tools, its lamp lit, carrying what can be done to them. Without the script it is the plain table.