LED bar chart
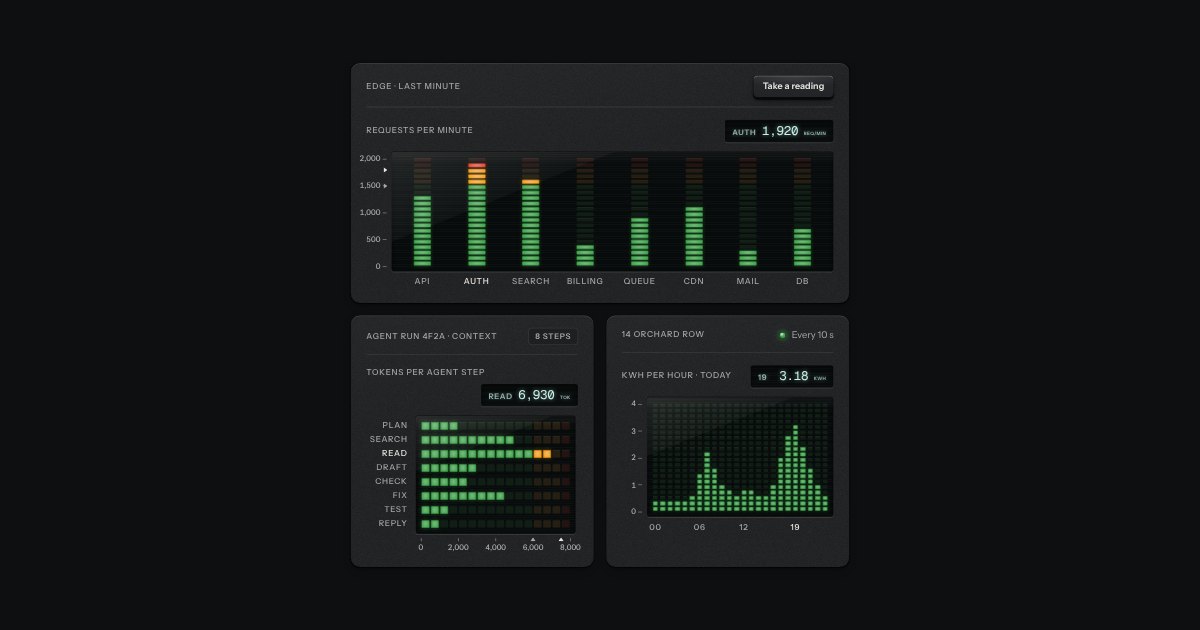
A bar chart built like a studio meter bridge: columns of LED segments behind a smoked window, green then amber then red, with a peak segment that lingers and a lit readout for the exact value.
Kit part · Charts
Printed bars on the panel, one value each. The bars are ink laid flat on the plate, never a colour and never glass; the axis is engraved into it, a groove along the zero line with the light on its lower lip and a faint rule at each tick. The values are a real list, one item a bar, so a screen reader reads “Thu, 73” and the picture is drawn over it. Columns by default, rows when the labels are long, and on display glass the ink is the display’s light.
Seats open in 11 days. Want one email that morning?
Both finishes, side by side. Hover, pressed and focus are forced with .is-hover, .is-down and .is-focus; checked and disabled are real.
Aluminium
| Part | Columns | Rows | A marked bar | On glass |
|---|---|---|---|---|
| Four values |
Graphite
| Part | Columns | Rows | A marked bar | On glass |
|---|---|---|---|---|
| Four values |
| Name | Kind | Values | What it does |
|---|---|---|---|
| figure.tui-bars[style="--max"] | element | a number | The figure. --max is the value at the top of the axis; every --v and --at is in the same unit. Add --row for rows. |
| figcaption.tui-label.tui-bars__title | element | what and the unit | Names the figure and says the unit (“Latency, ms”), because the list reads out only the figures. Without a caption, give the figure an aria-label. |
| .tui-bars__axis[aria-hidden] | element | spans with --at | The engraved axis, for the eye only. The first tick is the zero line, drawn as a groove; the others are faint rules. |
| ul.tui-bars__set[role="list"] | element | one li per bar | The values, as a real list. role="list" keeps it a list for a screen reader after the list style is taken off. |
| li.tui-bars__item[style="--v"] | element | a number | One bar: a label, then a slot holding the bar (aria-hidden) and its printed value. data-mark hatches and outlines the bar and bolds its label. |
| .tui-bars__said | class | inside the value | Words for a screen reader only (“, highest”), so a marked bar is not marked by looks alone. |
| --bars-h · --bars-row-h · --bars-label | custom property | lengths | The height of a column chart, the height of a row, and the width of the label column in rows. |
| barsHTML(options) · barsScale(max, count) | function | pure | The whole figure, and a top and ticks on whole steps of 1, 2 or 5. |
<!-- A figure with a caption, a real list of the values, and an axis drawn over it. --max and --v share a unit. -->
<figure class="tui-bars" style="--max:80">
  <figcaption class="tui-label tui-bars__title">Builds per day</figcaption>
  <div class="tui-bars__chart">
    <div class="tui-bars__axis" aria-hidden="true"><span style="--at:0">0</span><span style="--at:40">40</span><span style="--at:80">80</span></div>
    <ul class="tui-bars__set" role="list">
      <li class="tui-bars__item" style="--v:42"><span class="tui-bars__label">Mon</span>
        <span class="tui-bars__slot"><span class="tui-bars__bar" aria-hidden="true"></span><span class="tui-bars__value">42</span></span></li>
      <li class="tui-bars__item" style="--v:73" data-mark><span class="tui-bars__label">Thu</span>
        <span class="tui-bars__slot"><span class="tui-bars__bar" aria-hidden="true"></span><span class="tui-bars__value">73<span class="tui-bars__said">, highest</span></span></span></li>
    </ul>
  </div>
</figure>

<!-- Rows: add tui-bars--row to the figure. -->
import { barsHTML, barsScale } from '/kit/kit.mjs';
barsScale(73); // { max: 80, ticks: [0, 20, 40, 60, 80] } whole steps of 1, 2 or 5
figure.outerHTML = barsHTML({
title: 'Builds per day',
items: [{ label: 'Mon', value: 42 }, { label: 'Thu', value: 73, mark: true, note: 'highest' }],
orient: 'column', // or 'row'
});Needs kit.css only, no script. How to install the kit.
<ul> of items, each reading its label and then its figure (“Thu, 73”), so a screen reader gets every value in order. The bars and the axis are aria-hidden; nothing depends on seeing them.Each bar is ink on the plate with the height set from two numbers in CSS, --v over --max, so there is no script and no canvas. The axis is a set of spans placed from their own --at, with the zero line engraved the way the kit engraves a rule: a dark cut and a lit lower lip, which Quiet draws as a hairline. On glass the ink is the display’s own light.
Compare a handful of values side by side: ink bars on the plate, an engraved axis, each value printed at the end of its bar and listed for a screen reader.
6 rules in this file, with the foundations they rest on and the anti-patterns that break them. Full rules ship in the brain with the Pass.
A bar chart built like a studio meter bridge: columns of LED segments behind a smoked window, green then amber then red, with a peak segment that lingers and a lit readout for the exact value.
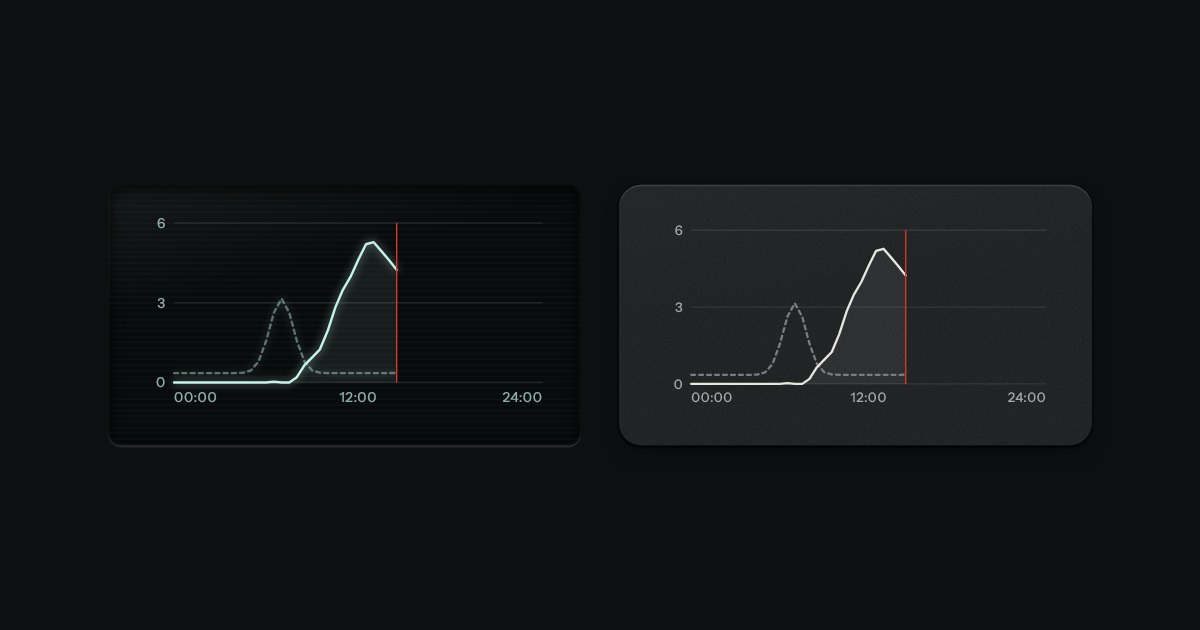
Line charts drawn as light on glass, or as ink on a panel: gridlines faint, two traces at most, a red line for now.
A word-sized line for the margin of a table or beside a readout. It is an SVG that takes the size of the type around it and the ink of the place it sits in, so on a panel it is ink and on display glass it is the display’s light. The last value is marked with a dot seated in a faint ring, and a lamp lights the dot when the reading matters. The trend and the last value are said in words on the image’s label, so the line is a second sign and never the only one.