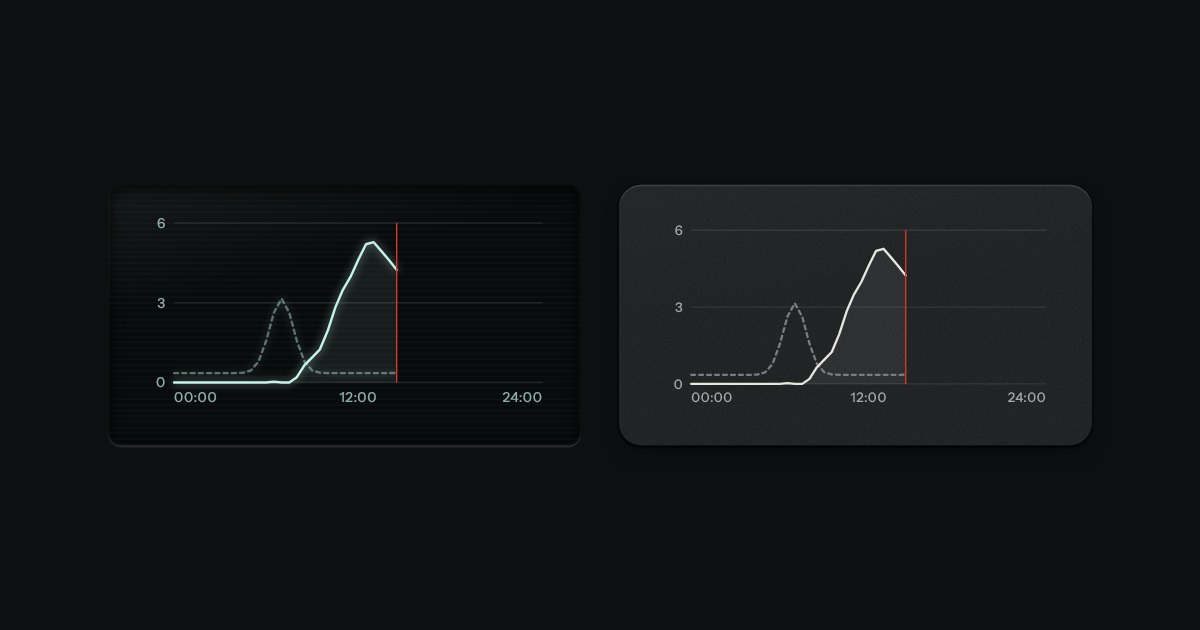
Plot
Line charts drawn as light on glass, or as ink on a panel: gridlines faint, two traces at most, a red line for now.
Kit parts
Points on two labelled scales, with a crosshair that reads the nearest point wherever the pointer is. Neither axis is forced to start at zero. Give each point a size and the circles take an area in proportion to it. With more than one series the series differ in shape as well as lamp: circle, square, triangle. Left and Right step through the points from the lowest on the horizontal axis to the highest, and the readout names each point with both values.
Seats open in 11 days. Want one email that morning?
The same display well and grid as the other charts, with the lamps as marks and a crosshair drawn in the display’s light. The nearest point is found by distance, so the whole plot is the target. The radius follows the square root of the value, so area reads true.
| Name | Kind | Description |
|---|---|---|
| Home · End | keyboard | Go to the first and the last point. |
| Escape | keyboard | Lets go of the point: the readout goes back to its sentence about the whole chart. |
| scatterModel() · scatterDraw() · scatterRadius() · scatterHTML() | function | The figures to a model with both scales, the drawing at a width, the radius for a size, and the static markup. |
Move the pointer anywhere over the plot: the crosshair snaps to the nearest point and tags both values on the axes. Tab onto the plot and use Left and Right to step from the lowest to the highest. Turn on size to see the circles take an area in proportion to the nights booked.
Line charts drawn as light on glass, or as ink on a panel: gridlines faint, two traces at most, a red line for now.
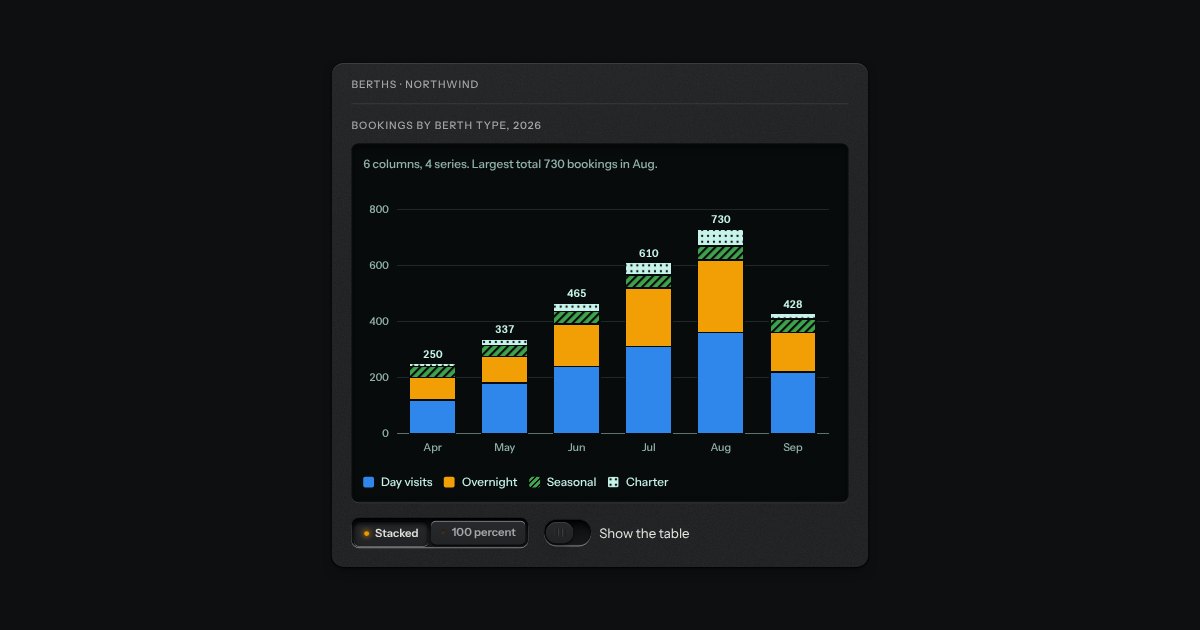
Columns split by series on a display well. Stacked mode reads totals from zero, with each total printed above its column. The series are the lamps (blue, amber, green) and the display’s own light, and from the third on they have a pattern too, so no series is only a colour. Move the pointer across the columns, or use the arrow keys, and the readout says the series, its value, its share and the total. The legend keys turn a series off and on, and the scale follows.
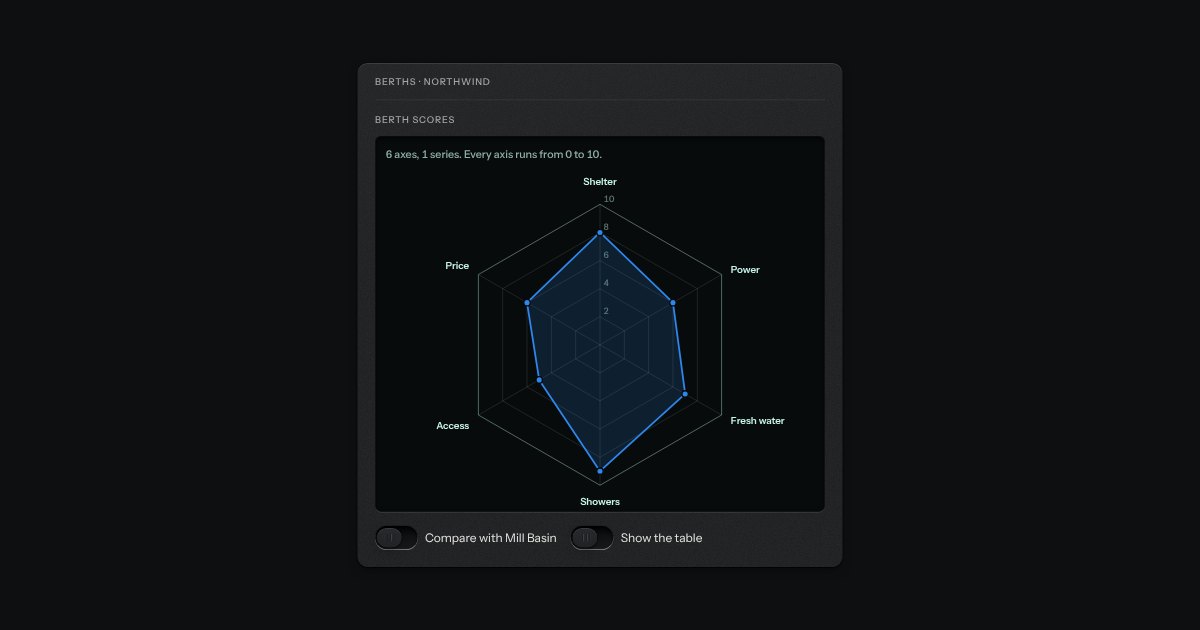
One value on each of several spokes, joined into a shape on straight-sided rings of one shared scale that starts at zero in the middle. The ring values are printed along the first spoke so a value can be read, not only compared. One or two series, lightly filled; the second has a dashed edge and square markers. Left and Right step round the spokes, Up and Down switch series. There is nothing sweeping or turning.
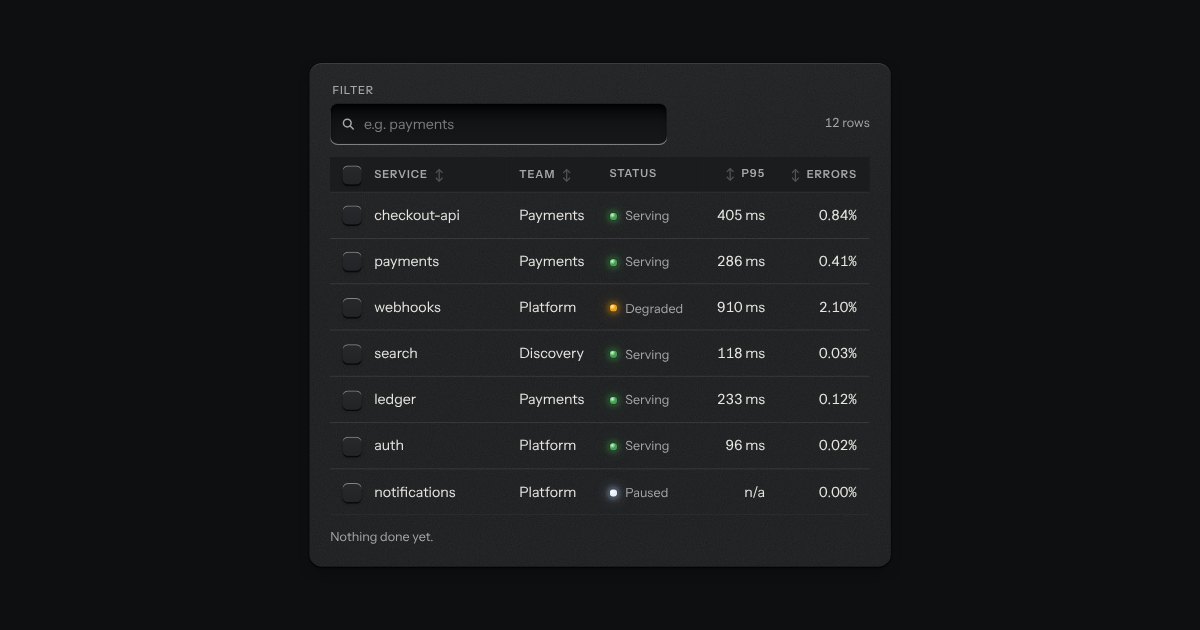
The kit’s table with the tools a working one needs: headers that sort, a filter well, a check key on every row with one in the header that selects them all and sinks half way when only some are chosen, and a header that stays at the top while the rows scroll under it. While rows are chosen a plate slides out of a slot under the tools, its lamp lit, carrying what can be done to them. Without the script it is the plain table.