Lamp
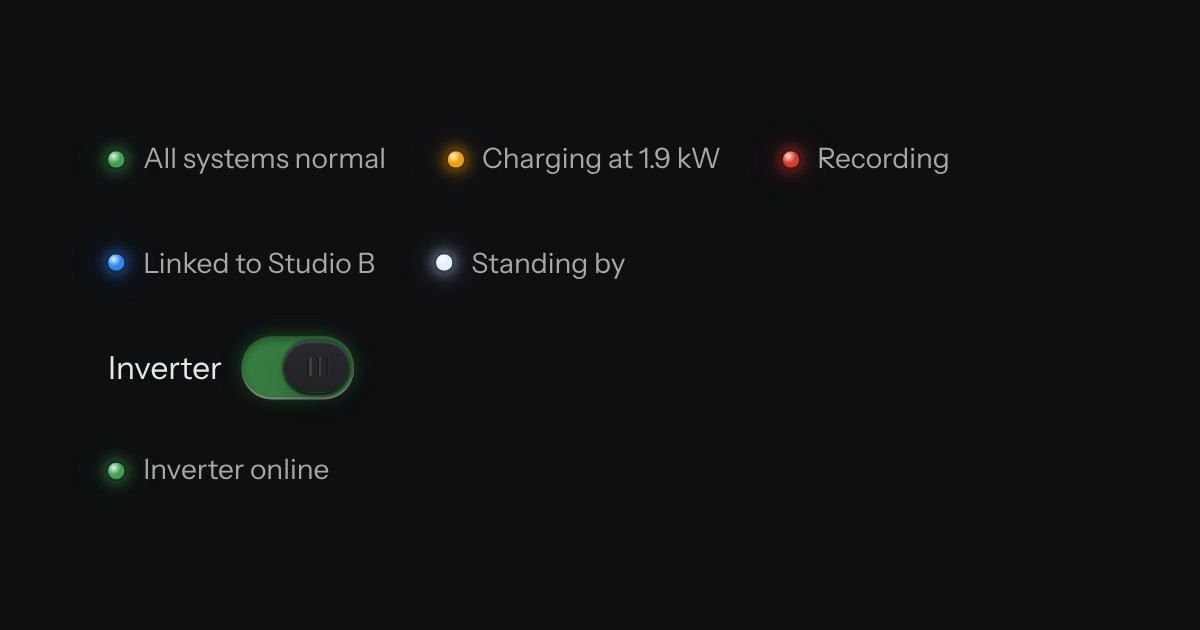
The only colour in the kit: a lamp that is on. Green is on, amber is waiting, red is recording or failing, blue is linked, white is standing by. Always next to words.
Kit parts
A heatmap as a matrix of small panel lamps set into the plate: each lamp’s brightness is the value, off to full in four steps, with a printed legend. Deploys per day over a year, incidents by hour of the week, energy by the hour.
Seats open in 11 days. Want one email that morning?
Two layers. The sockets are spans in rows, so the ARIA grid is real and the columns line up: each is a hole in the plate (a dark ring, the upper wall’s shadow falling on the glass, a lit lower lip) with the lens’s reflection of the room’s lamp, the same on every lamp, so it never moves with the brightness. The sockets carry the focus and hover rings and never restyle when the data changes. Behind them is one canvas: every unlit lens (dark glass tinted by the lamp colour) is baked once per layout, and the lit lamp (a warm-white core in the lamp colour, darker at the rim, inside its glow) is one sprite, drawn at the step’s brightness. A frame is one blit per lit lamp.
| Name | Kind | Description |
|---|---|---|
| layout | attribute | |
| start | attribute | Calendar: the day of the first value. |
| rows · cols · row-labels · col-labels | attribute | Grid: the size, and the names printed down the side and across the top. |
| values | attribute | The values from markup, in the layout’s order; an empty place or a dash is no reading. |
| label · unit · unit-one | attribute | The chart’s name; the unit read with every value (“6 deploys”, and “1 deploy” with unit-one). |
| min · max | attribute | The range cut into four equal steps. At min or below a lamp is off. |
| thresholds | attribute | The lower bound of each step instead; the legend prints them. |
| precision · locale · first-day | attribute | Decimals of a value; the language of dates; the weekday in the top row (0 Sunday … 6). |
| summary | attribute | How the values are summed up. Counts add up (the default. |
| data-lamp | attribute | The lamps’ colour, one per chart: green for things done, red for failures, blue for traffic that only informs, white for plain counts, amber otherwise. |
| pick | event | A lamp was chosen: click, Enter or Space. |
| Arrows | keyboard | Across and down the grid; blank sockets are skipped. In a calendar, down is the next day and right the next week. |
| Home · End | keyboard | The first or last lamp in the row, or in the whole grid. |
| PageUp · PageDown | keyboard | Back or on four columns: about a month in a calendar, four hours in a week. |
| Enter · Space | keyboard | Fires pick for the focused lamp. |
Hover a lamp, or Tab into the grid and use the arrows, Home/End and PageUp/PageDown: the display reads the day. Switch the year and every lamp fades to its new level.
The only colour in the kit: a lamp that is on. Green is on, amber is waiting, red is recording or failing, blue is linked, white is standing by. Always next to words.
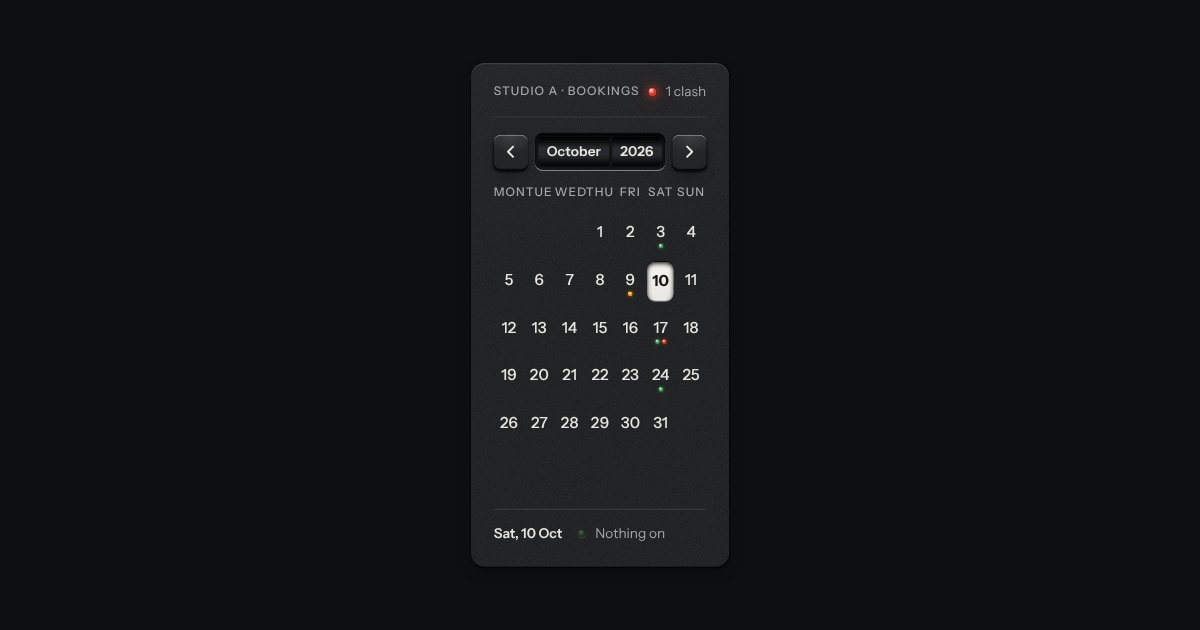
A month on a plate. The month and year sit on two drums behind a window and roll when you page; the chosen day is a latched cap, a range is a groove cut between two caps, and events are lamps named in the line below.
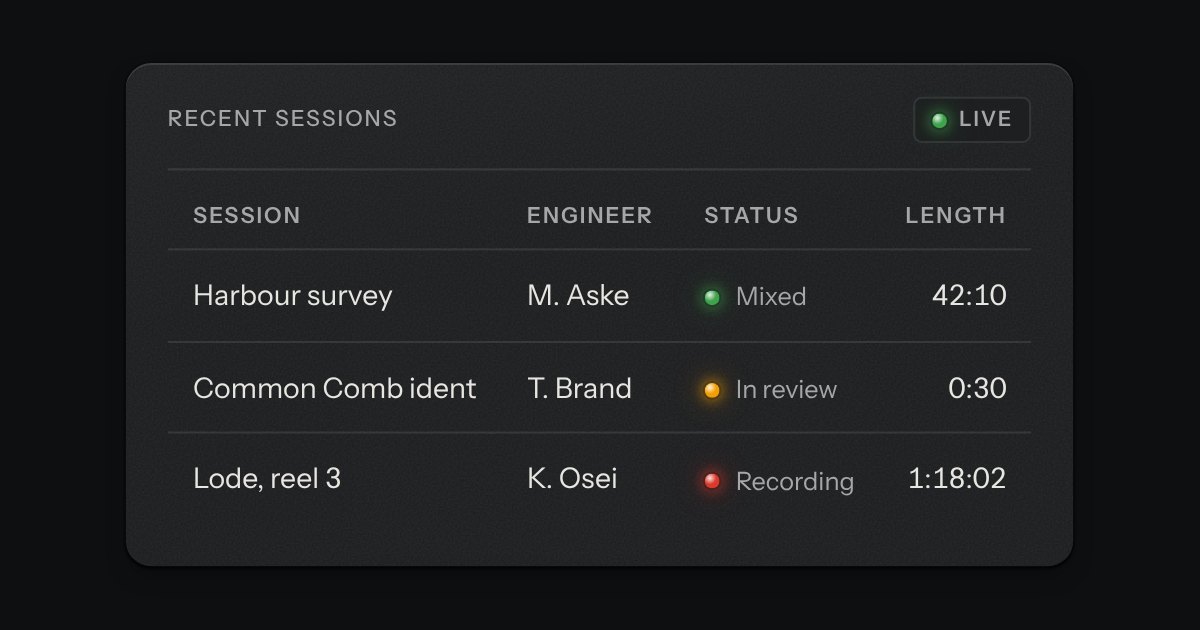
Rows of data with printed column labels, figures right-aligned in columns, and status in lamps with words.